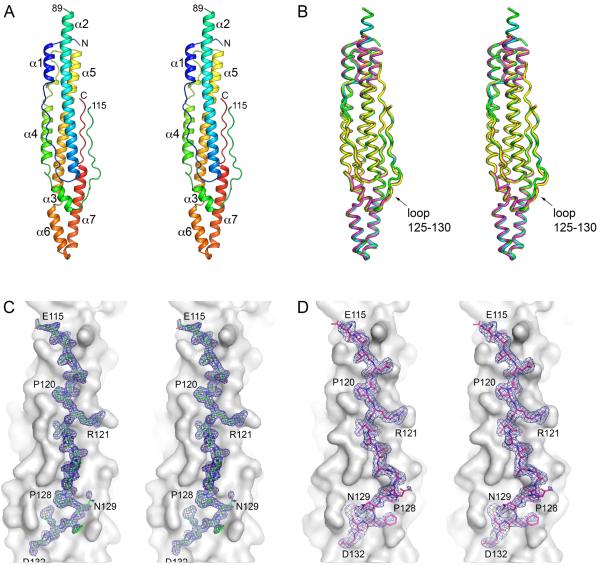
Fig. 2.
Structure of M. tuberculosis EspB.
A. A stereo view of EspB7-278 structure (PDB: 4XXX) in cartoon representation colored in rainbow colors from the N-terminus (blue) to the C-terminus (red). The loop between helices α2 and α3 that connects PE and PPE domains of EspB is partially disordered (residues 90–114).
B. A stereo view of superposition of available EspB structures in ribbon representation. Cyan: EspB7-278 in space group C2221 (PDB: 4XWP); green: high-resolution structure of EspB7-278 in space group C2221 (PDB: 4XXX); magenta: EspB7-278 in space group I222 (PDB: 4XXN); yellow: EspB1-460 (PDB: 4XY3). The C-terminal domain of full-length EspB1-460 is disordered. All structures are similar with the largest deviations found in the PE–PPE loop (residues 125–130). Structures were aligned using least-squares (LSQ) superposition in Coot (Emsley et al., 2010).
C and D. Stereo views of PE–PPE loop in EspB7-278 structure in space group C2221 (PDB: 4XXX) – (C) and in EspB7-278 structure in space group I222 (PDB: 4XXN) – (D). Residues 115–132 are shown in stick representation with σA-weighted 2FO-FC electron density map contoured at 1σ. The rest of protein is shown as grey surface.

