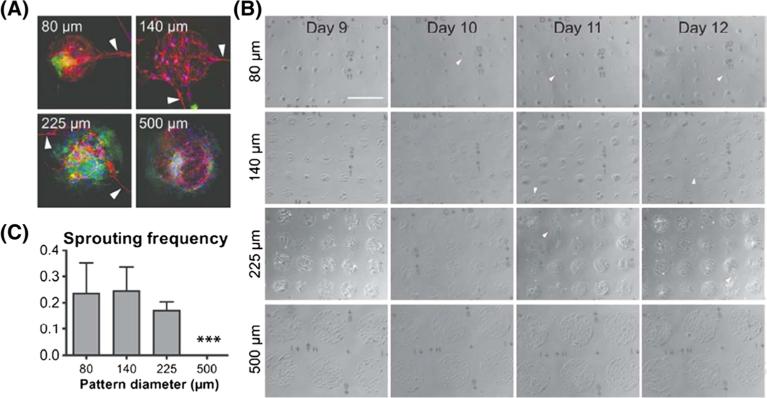
Figure 4.
Characterization of sprouting propensity. (A) Immunofluorescent images of instances of sprouting on all pattern sizes; VEcad in red, PDGFRβ in green and DAPI in blue. (B) Light microscope images depicting emergence of sprouting over time on pattern sizes; scale bar = 500 μm. (C) Quantification of sprouting frequency; arrowheads, instances of sprouting

