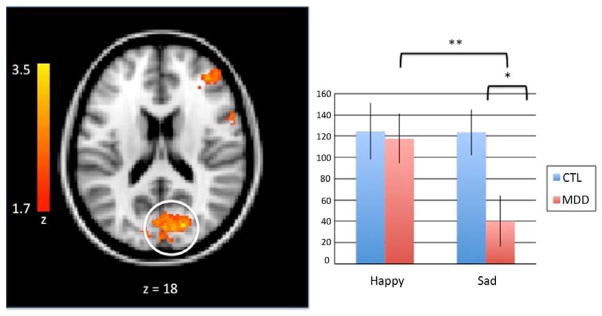
Figure 3.

A group (MDD, CTL) by valence (happy, sad) by condition (go, no-go) analysis of variance revealed decreased BOLD signal in the occipital cortex in response to sad face - no-go target trials in the MDD group. Activation maps (left) are thresholded at a Z > 2.0 and corrected for multiple comparisons using a cluster-based p < .05. MNI coordinates are indicated for slice distance (in mm). Parameter estimates (showing the amount of signal change measured in arbitrary units) of BOLD signal response were extracted from this functionally-defined ROI in the occipital cortex (circled) and plotted in the bar graph (right).
