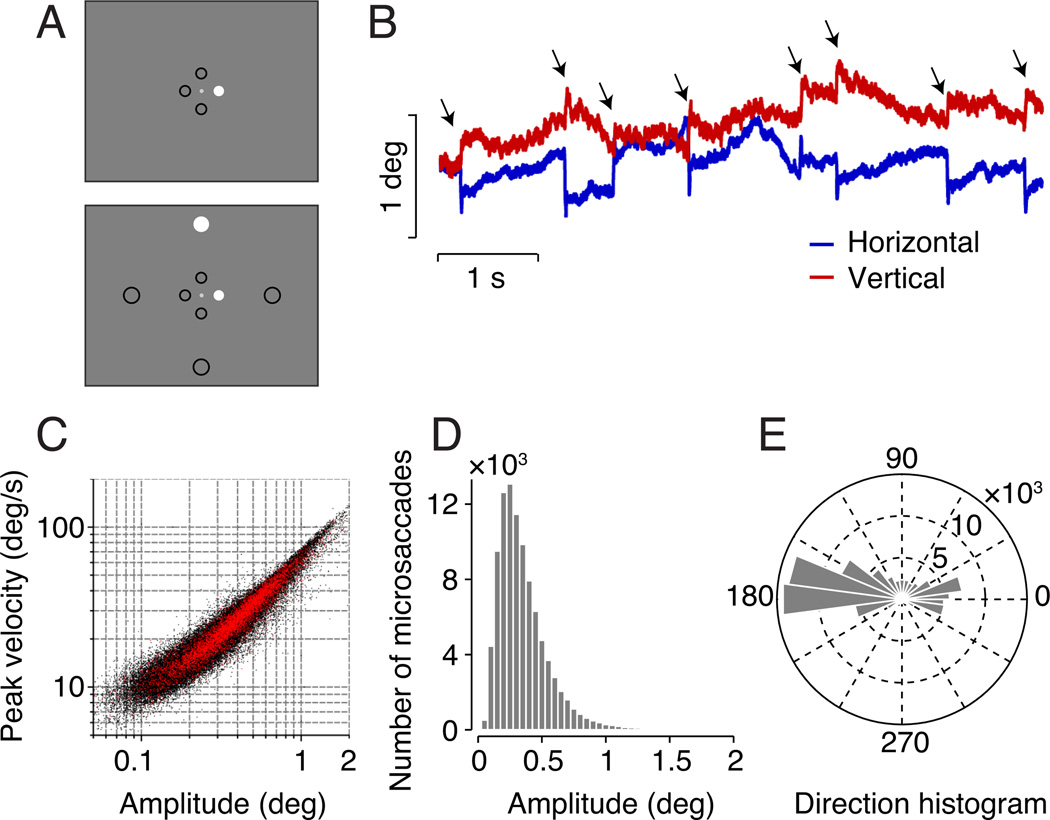
Figure 1.
Stimulus and fixational saccade statistics. A. Parafoveal and peripheral stimuli. Parafoveal stimuli (0.8 deg eccentricity) and peripheral stimuli (5 deg eccentricity) each appeared at one of four cardinal locations (above, below, left, or right of fixation), as denoted by black circles. Black circles did not appear in the actual stimulus. Top, a parafoveal stimulus was presented alone (right parafoveal stimulus shown). Bottom, a parafoveal stimulus was paired with a peripheral mulus (right parafoveal and top peripheral stimulus shown; 16 total possible combinations). Stimuli are schematic and not to scale. B. An example epoch of recorded eye position traces. Blue and red, horizontal and vertical eye positions, respectively. Arrows indicate fixational saccades. C. Main sequence. Peak velocity versus saccade amplitude from all observers (n = 8). Black, all fixational saccades included in the analysis (< 2 deg). Red, congruent fixational saccades during the 100–250 ms time epoch. D. Amplitude distribution of fixational saccades from all observers. E. Direction distribution of fixational saccades from all observers.

