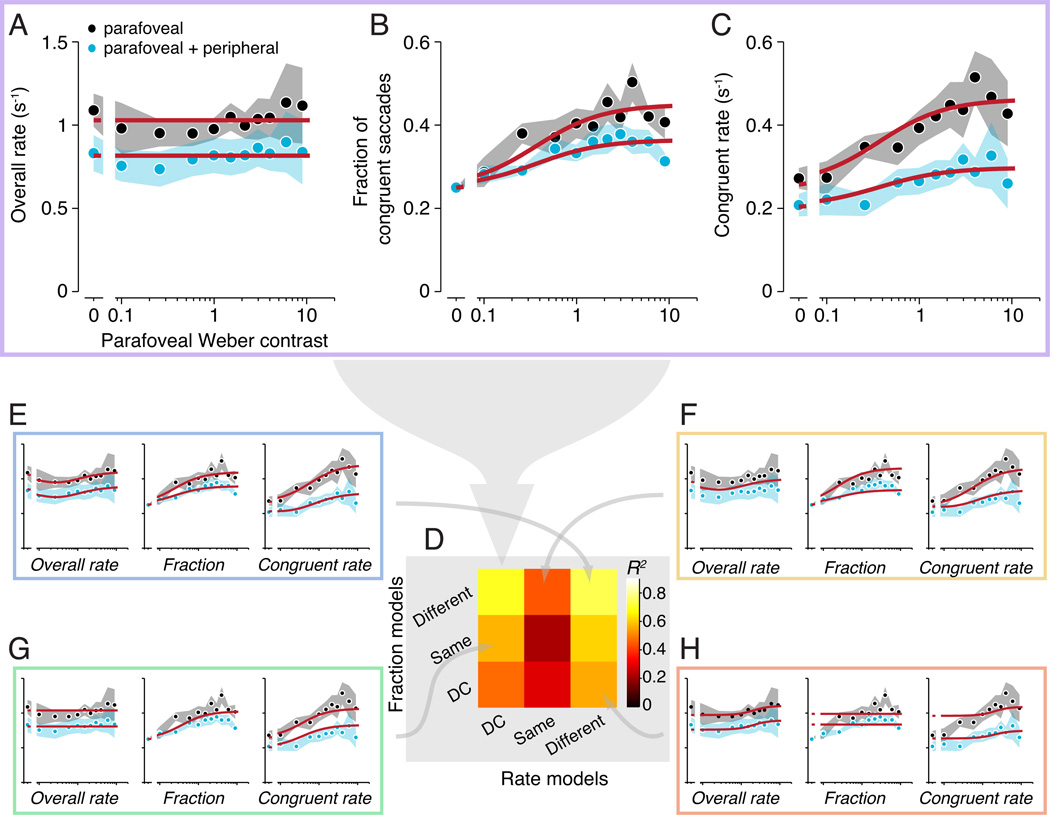
Figure 3.
Suppression of fixational saccades by peripheral stimuli. A–C. Fixational saccade rate during the 100–250 ms time epoch, as a function of parafoveal contrast. Black, parafoveal stimuli presented alone. Cyan, parafoveal stimuli paired with a peripheral stimulus. Circles and shaded regions, mean and SEM across observers. Red curves, best-fitting model (combined DC Rate and Different fraction model; see text). A. Overall fixational saccade rate (any direction) as a function of parafoveal contrast. B. Fraction of congruent fixational saccades as a function of parafoveal contrast. Leftmost points (parafoveal contrast = 0) correspond to a baseline fraction of 1/4. C. Congruent fixational saccade rate as a function of parafoveal contrast. Leftmost points (parafoveal contrast = 0) correspond to baseline congruent rates (overall rates multiplied by 1/4). D. Goodness-of-fit (R2) for every combination of fraction and rate models (3 each, yielding 9 combined models). Colors indicate median R2 (across 1000 permutations of cross validation; see Materials and Methods: Model fitting). Large gray arrow, model shown as the red curves in panels A–C. E–H. Combined model fits. Gray arrows indicate the corresponding model in the matrix. Identical data, axes, and format as panels A–C.

