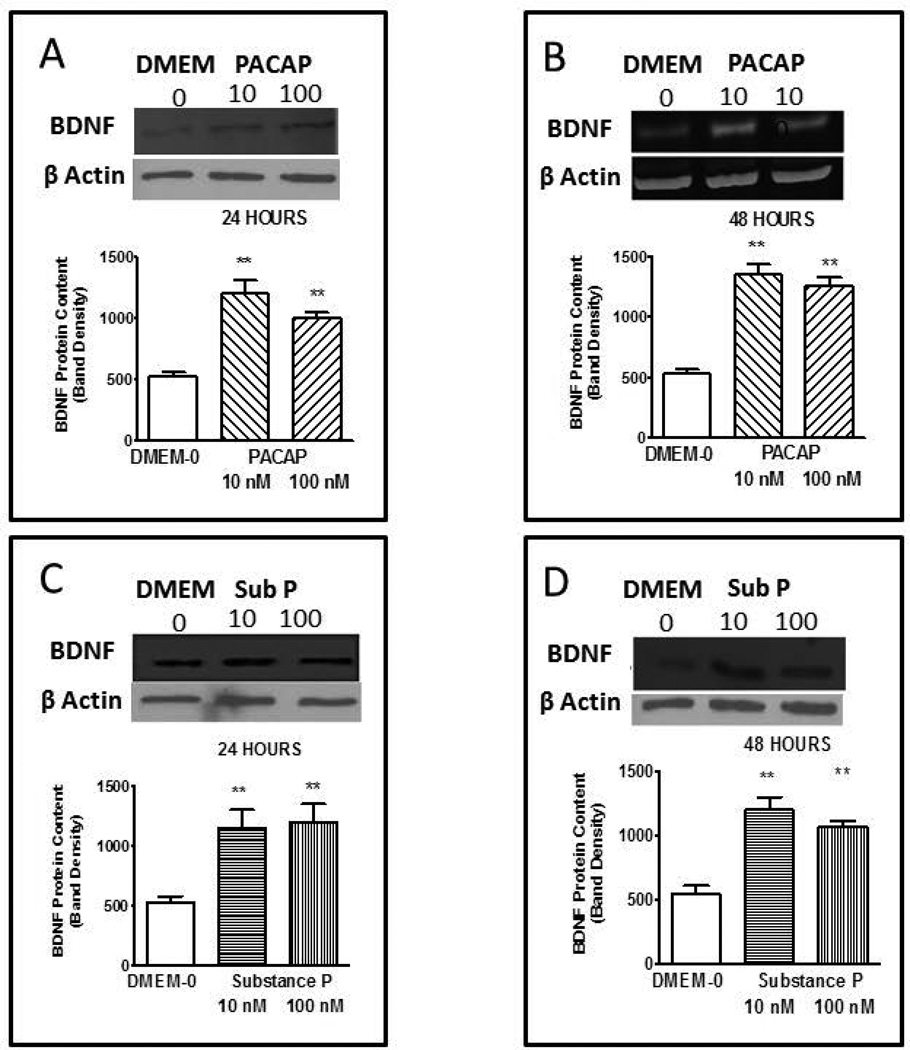
Figure 3.
Expression of BDNF synthesis induced by PACAP and substance P. Incubation with longitudinal smooth muscle cells in culture with PACAP at 10 and 100 nM for 24 (A) and 48 (B) hrs or substance P ar 10 and 100 nM for 24 (C) and 48 (D) hrs increased expression of BDNF above control levels obtained with incubation in DMEM-0. Bar graphs illustrate optical density of BDNF blots normalized to β actin. Band density of the control DMEM-0 was 522 ± 38 in arbitrary units. Inserts illustrate typical blots. Values are Mean ± SEM; n=5–7; **= p<0.01 for difference from expression in presence of DMEM-0.

