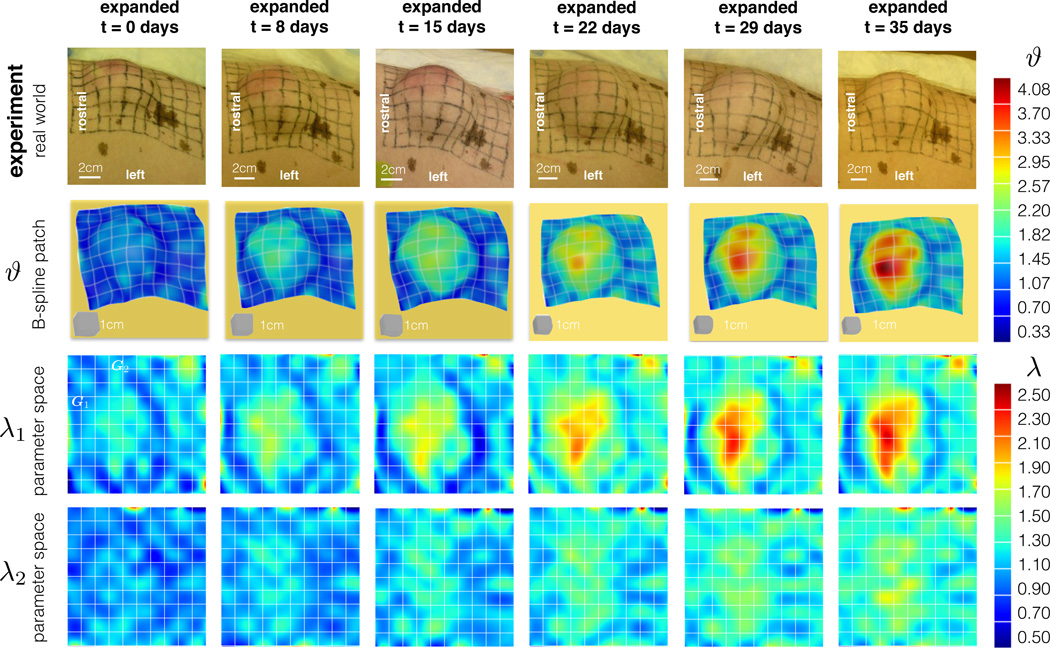
Fig. 9.
Deformation. The columns depict the chronic overstretch due to weekly inflations. The first row shows photographs of the experimental setup at different points in time. Sets of photographs at each time point allow us to reconstruct the B-spline patches in the second row. We are interested in the total area change ϑ as well as stretches λ1 and λ2 parallel and perpendicular to the midline. The contour plots reveal larger strains at the center of the expander and smaller strains in the periphery.

