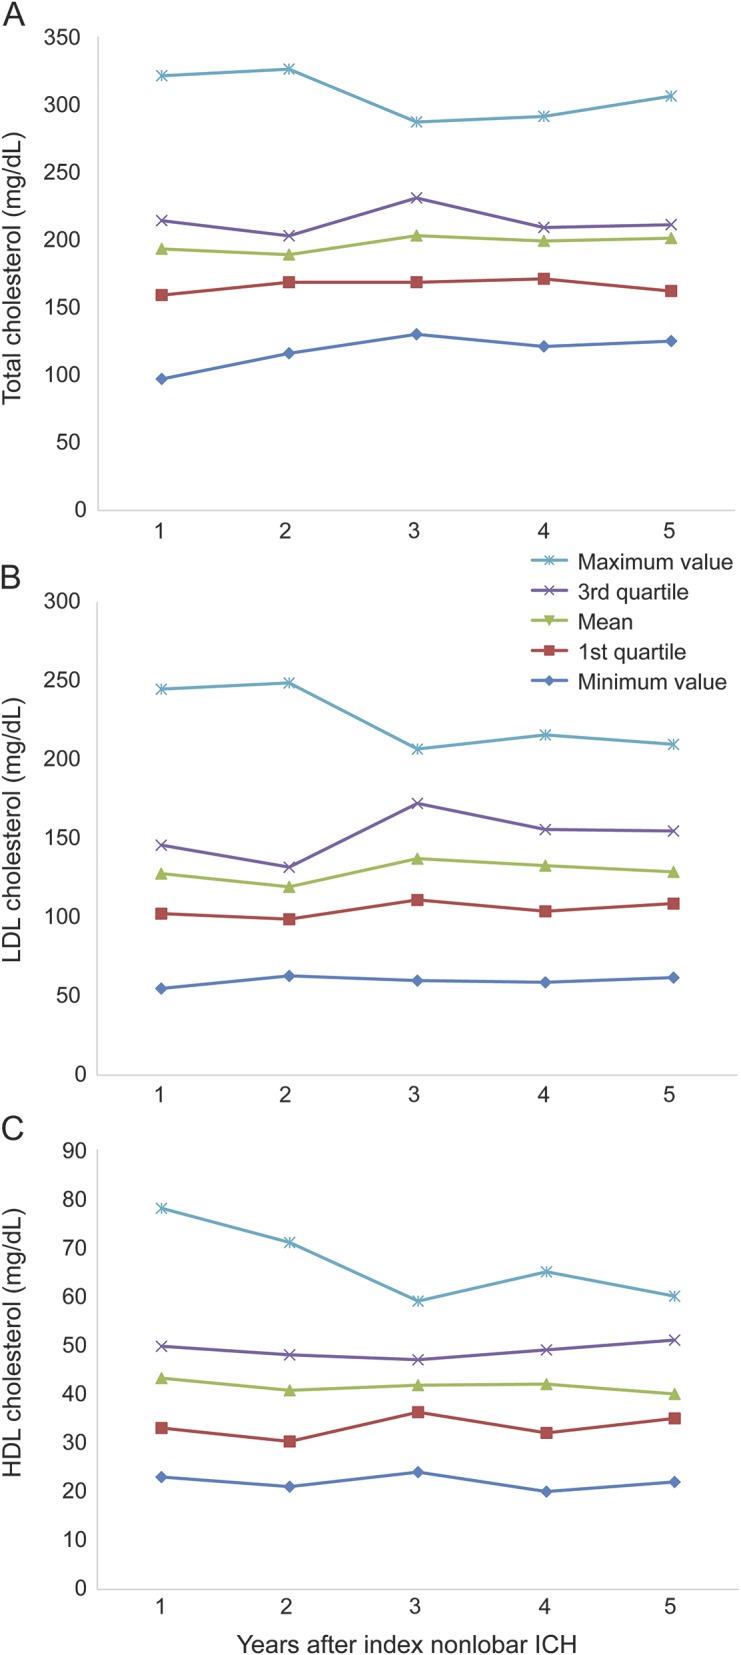
Figure 1. Total cholesterol and lipid fraction measurements during follow-up.

(A) Total cholesterol levels for entire study population during follow-up time. Individual lines connect minimum, first quartile, mean, third quartile, and maximum values per each year as detailed in the figure legend. (B) LDL cholesterol levels for all study participants during follow-up time (legend as in A). (C) LDL cholesterol levels for all study participants during follow-up time (legend as in A). HDL = high-density lipoprotein; ICH = intracerebral hemorrhage; LDL = low-density lipoprotein.
