Fig. 4.

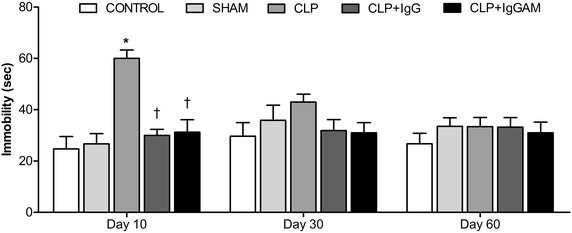
Forced swimming test on days 10, 30 and 60. Immobility times in FST. Data are shown as mean ± SEM; *p < 0.01 compared to control, † p < 0.01 compared to CLP. FST forced swimming test, CLP Cecal Ligation Perforation.

Forced swimming test on days 10, 30 and 60. Immobility times in FST. Data are shown as mean ± SEM; *p < 0.01 compared to control, † p < 0.01 compared to CLP. FST forced swimming test, CLP Cecal Ligation Perforation.