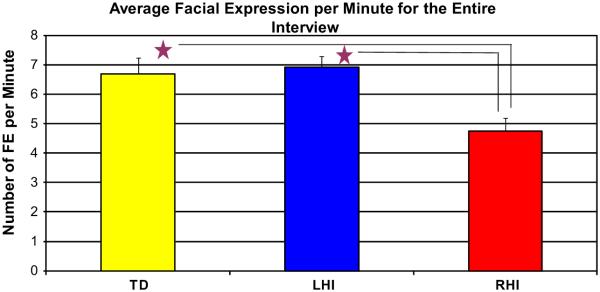
Fig. 3.

Frequency of facial expression per minute during the entire biographical interview. The TD and LHI groups are producing significantly more facial expression than the RHI group over the course of the biographical interview (Error bars reflect standard errors).
