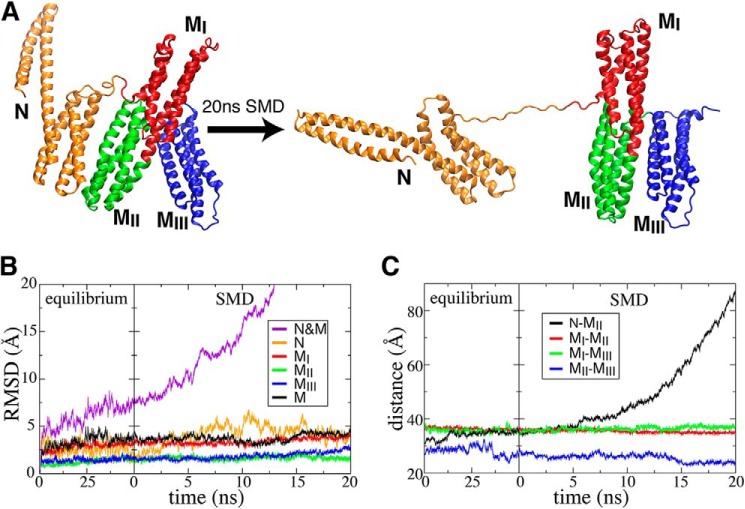
FIGURE 4.
Structural response of protein construct N-M (residues 82–635) to mechanical force. A, initial and final snapshots of a 20-ns SMD simulation (trajectory 1). Evolution of the backbone r.m.s.d. (B) and centers of mass distances between pairwise domains (C) are shown as a function of time during the initial 50-ns equilibrium (trajectory 1) and the following SMD simulation (trajectory 22).

