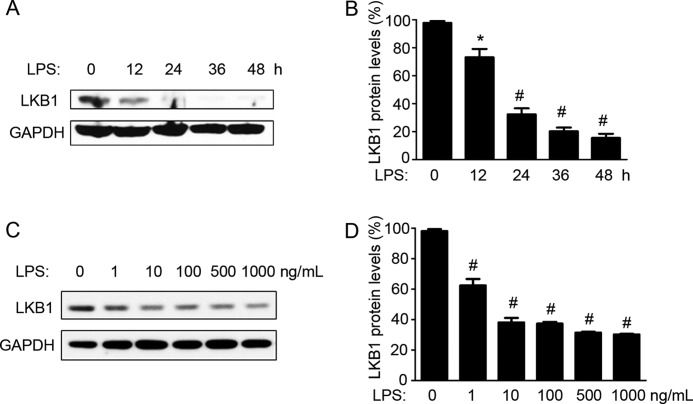
FIGURE 1.
LPS induces LKB1 loss in macrophages. A, RAW 264.7 cells were treated with LPS (100 ng/ml) for the indicated times. B, quantification of LKB1 protein levels as in A (n = 4). *, p < 0.05 versus control. C, RAW 264.7 cells were treated with different doses of LPS for 24 h. D, quantification of LKB1 protein levels as in C (n = 3). #, p < 0.01 versus control.

