FIGURE 7.
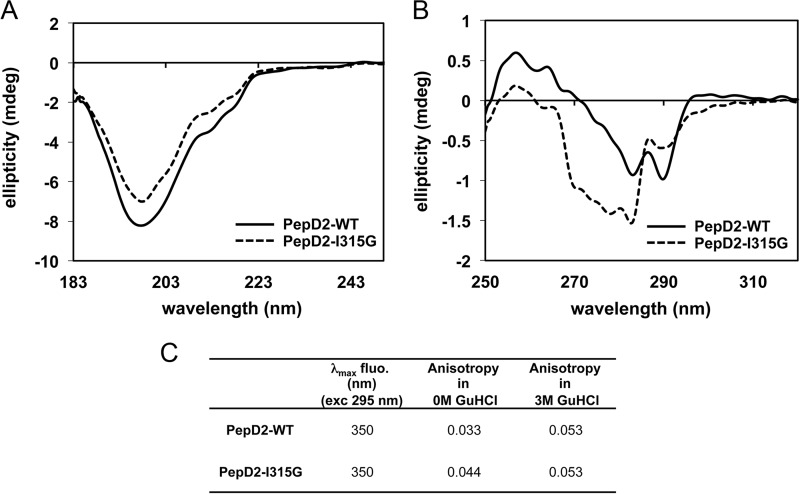
CD and fluorescence spectroscopy analyses of PepD2-WT and I315G mutant. A and B correspond to far and near UV CD analyses of PepD2-WT (plain black lines) and PepD2-I315G (dashed gray lines). A, the far CD spectra of both peptides are significantly different in intensity even though the concentrations were adjusted precisely (see “Experimental Procedures”). A small difference in shape is observable. B, the near UV CD spectra of both peptides are also very different in intensity and shape. The tryptophan (Trp316), tyrosine (Tyr321), and phenylalanine (Phe309) may all contribute to the CD signal in the 260–280-nm region (71). The spatial arrangement of these groups in the protein determines the sign and intensity of the CD bands in the near UV (71). Therefore, the near UV CD spectrum of a protein or a peptide reflects its conformation. From this CD analysis, we concluded that the aromatic residues Phe309, Trp316, and Tyr321 have different relative orientations in PepD2-WT and PepD2-I315G. This result is consistent with the presence or absence of a structural motif. C, tryptophan fluorescence spectroscopy. When excited at 295 nm, both peptides display a maximum of emission at 350 nm, in agreement with the expected exposition of their single Trp residue to the water solvent. The anisotropy observed for the PepD2-WT (0.033) was significantly inferior to that observed for the PepD2-I315G (0.044). Because both peptides are small (20 residues) and have the same size, the fluorescence anisotropy of their single Trp reflects their global motions in solution. The PepD2-WT peptide is thus more compact in solution than the PepD2-I315G peptide. When measured in the presence of 3 m guanidine HCl, the anisotropy of both peptides became higher and equivalent (0.053). These results are consistent with the presence of a local structuration in PepD2-WT in the absence of guanidine.

