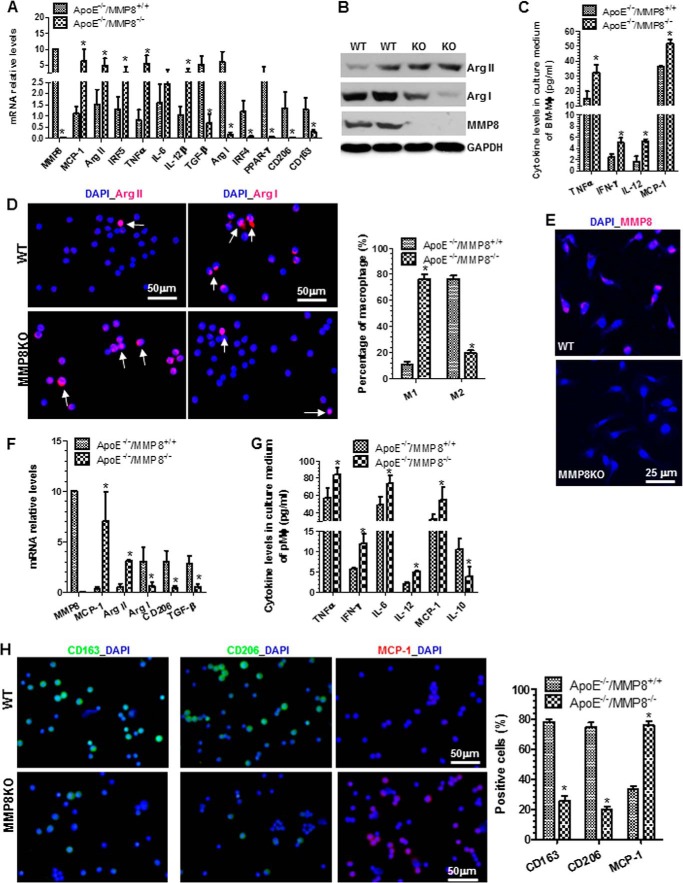
FIGURE 2.
MMP8 is required for M2-Mφ differentiation. A, RT-qPCR analysis of expression levels of M1- and M2-Mφ genes in the day 14 of differentiated bone marrow Mφ (BMMφ). B, Western blot analyses show that the protein expression levels of Arg I, Arg II, and MMP8 in WT and MMP8KO BMMφ. C, ELISA analysis of the inflammatory cytokine levels in the culture medium conditioned by BMMφ. D, immunofluorescence staining shows that the percentage of M2-Mφ in MMP8KO (ApoE−/−/MMP8−/−) differentiated BMMφ is much lower than that of WT (ApoE−/−/MMP8+/+) BMMφ. Arrows indicate M1-Mφ (cells are positive for Arg II) or M2-Mφ (cells are positive for Arg I). E, immunofluorescence staining of MMP8 in WT and MMP8KO BMMφ. F, RT-qPCR analysis of M1- and M2-Mφ gene expression levels in the naive peritoneal Mφ (pMφ) isolated from the peritoneal cavity of WT and MMP8KO mice. G, ELISA analysis of the inflammatory cytokine levels in the culture medium conditioned by WT and MMP8-deficient pMφ. H, immunofluorescence staining shows that MMP8 deficiency results in a M1-Mφ phenotype in pMφ. The data presented here are representative or an average of three to six independent experiments. *, p < 0.05 (versus WT). Shown in panels D and H are representative images each from three independent experiments, and column charts of the percentage of M1- and M2-Mφ. *, p < 0.05 (versus WT).

