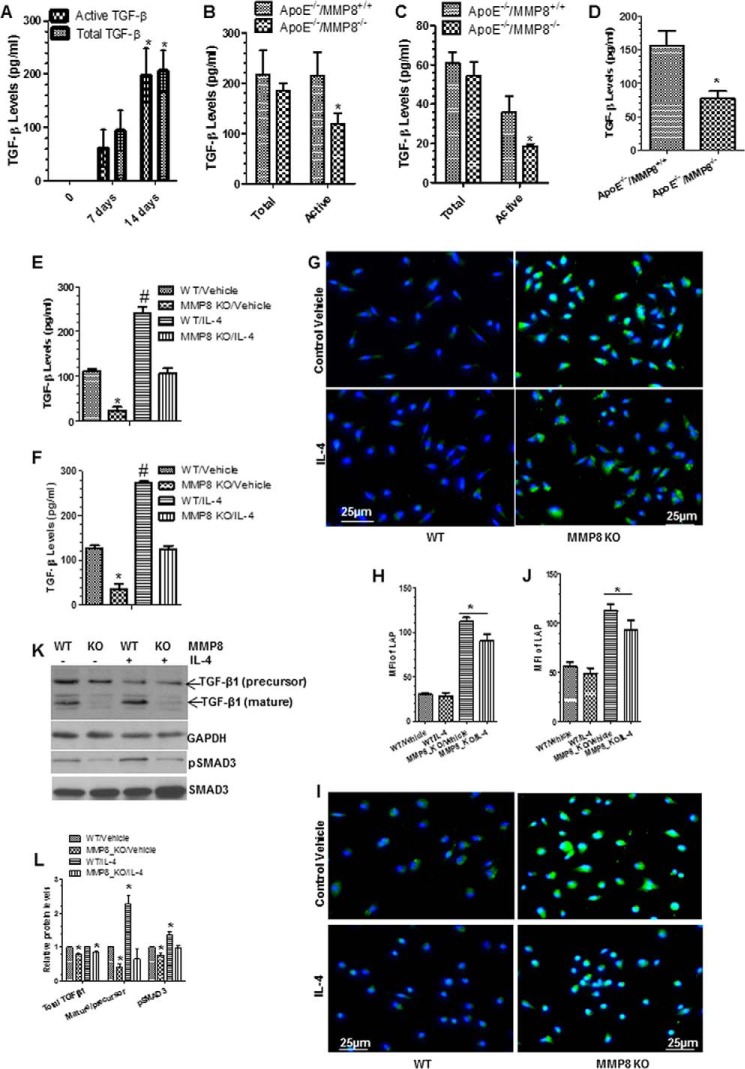
FIGURE 6.
Bioavailability of TGF-β was mediated by MMP8 during macrophage differentiation and polarization. Cells were cultured and treated as described previously. Conditioned culture medium (CM) were harvested and subjected to ELISA analyses. A, both total and active TGF-β levels were significantly increased during bone marrow macrophage differentiation from monocytes. B and C, active, not total TGF-β levels in MMP8-deficient BMMφ (B) and pMφ (C) were lower than that of WT macrophages. D, active TGF-β levels in the peritoneal cavity fluid of MMP8-deficient mice were lower than that of WT mice. E and F, active TGF-β levels in CM of WT and MMP8-deficient BMMφ (E) and pMφ (F) in response to IL-4 polarization. The data presented here are an average of three to four independent experiments. *, p < 0.05 (day 14 versus 7 or MMP8KO versus WT); #, p < 0.05 (Mφ inducers versus control). G-J, MMP8-deficiency results in higher amount of LAP on BMMφ (G and H) and pMφ (I and J). Cells were fixed and subjected to immunofluorescence staining analyses with antibody against LAP (N terminus of TGF-β1). Shown in the figure are representative images each from three independent experiments, and column charts of mean fluorescence intensity (mean ± S.E., n = 20). *, p < 0.05 (versus controls). K and L, Western analyses of the expression levels of TGF-β and pSMAD3. Proteins were harvested and subjected to Western blot analyses with the antibodies against the C terminus of TGF-β and pSMAD3 (phospho-Ser423/Ser425). Note: the molecular mass for the bands of TGF-β1 (precursor) and TGF-β1 (mature) in panel K are ∼37.5 and ∼12.5 kDa, respectively. GAPDH and total SMAD3 were included as internal controls. Shown in the figure are representative images each from three independent experiments, and column charts of relative protein levels (mean ± S.E., n = 3). *, p < 0.05 (versus WT/vehicle).

