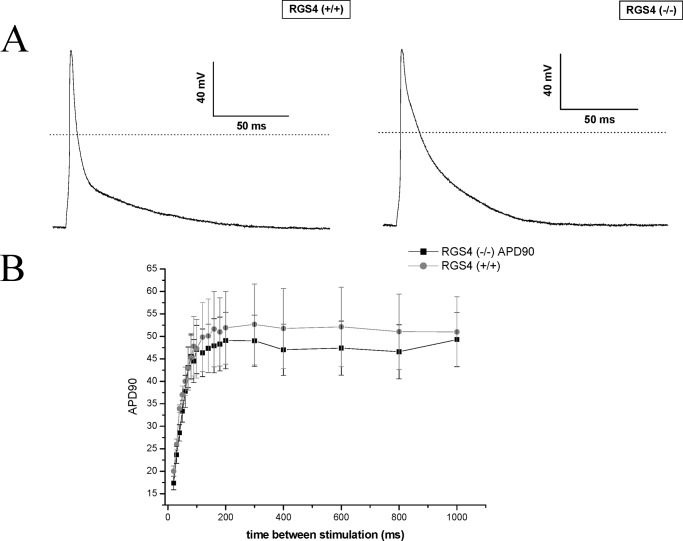
FIGURE 3.
The electrophysiology of single atrial cells. A, atrial action potentials are shown for RGS4+/+ and RGS4−/− mice. Representative traces of an action potential measured after stimulation of a cell by a 5-ms pulse after pacing at 1 Hz for 60 s. B, single-cell restitution that was not different between the two lines of mice.

