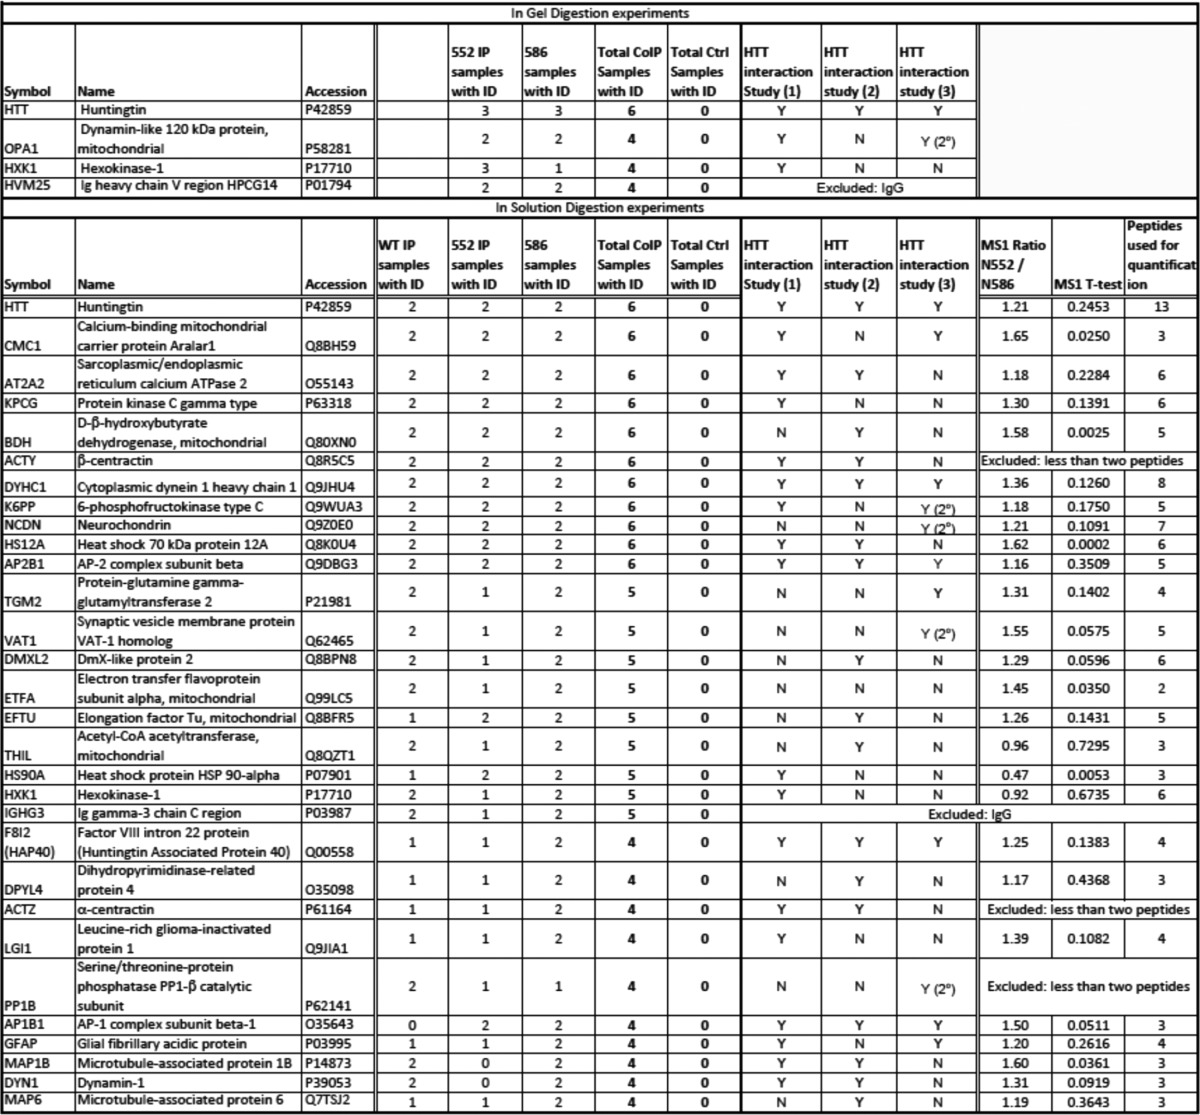
TABLE 1.
HTT interacting proteins identified by mass spectrometry
The coIP with MAB2166 and mIgG followed by mass spectrometry was performed using two methods (in-gel and in-solution) on a total of 12 mice. The coIP and control samples from N552 (n = 3) and N586 (n = 3) mice were analyzed after in-gel digestion. An additional N552 (n = 2), N586 (n = 2) and WT (n = 2) mice were analyzed by in-solution digestion. Proteins were considered to be identified in samples if 2 or more peptides were identified at >95% confidence. Proteins identified only in IP samples are reported in this table. HTT protein was identified 6 of 6 CoIPs in both in-gel and in-solution samples and 0 of 6 control samples in both in-gel and in-solution digestion. For in-gel digestion a total of 68 proteins were identified exclusively in at least one CoIP sample, here we present four proteins that were identified in at least four CoIP samples with none identified in control samples. For in-solution digestion a total of 232 proteins were identified exclusively in at least one CoIP sample, here we present 30 proteins that were identified in at least four CoIP samples with none identified in control samples. These proteins were cross-referenced to published data sets from three other groups as follows: Shirasaki et al. (68); Culver et al. (69); and Kaltenbach et al. (66). All but one have previously been reported as primary or secondary HTT interacting proteins. Proteins identified as secondary interactors are indicated as 2°. Finally, the proteins from one biological replicate (three injections) of the in-solution digestion were quantified by mass spectrometry in N552, N586 and a WT mouse using MS1 filtering in Skyline (48) to screen for proteins whose levels putatively differ between N552 and N586 mice. These levels were quantified by integration of the peak area of the identified peptides (number of peptides used for quantification is indicated). Peak areas were then summed and N552/N586 ratio, standard deviation, and p values were calculated.

