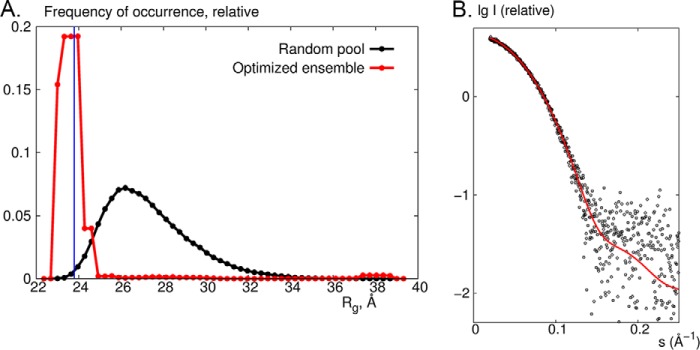
FIGURE 5.

SAXS on SiRHP. A, ensemble optimization method analysis showing the Rg distributions from a pool of 10,000 models generated by adding 80 N-terminal residues as a random loop of a native-like chain (black) and for the optimized ensemble of which the averaged theoretical scattering profiles fit the experimental data (red). The blue line corresponds to Rg = 23.8 Å estimated from the x-ray crystal structure of spinach NiR (Protein Data Bank accession code 2AKJ (38)). B, comparison of experimental data (black circles) with the theoretical x-ray scattering profile calculated from the x-ray crystal structure of NiR (red) by use of the program CRYSOL (32).
