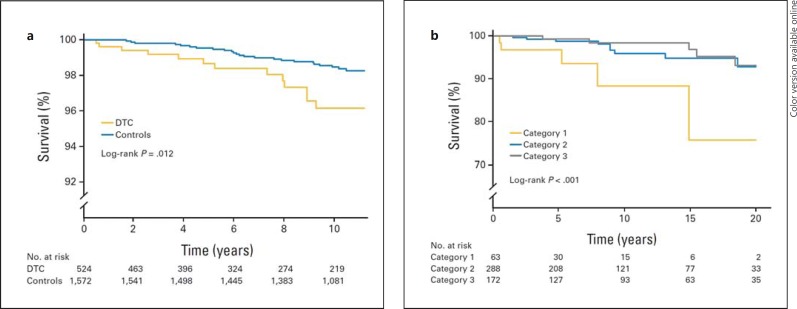
Fig. 4.
Kaplan-Meier curves of cardiovascular mortality in DTC patients versus controls (a), and cardiovascular mortality by TSH category (b), for patients with DTC. TSH category 1 represents a geometric mean TSH during follow-up below 0.02 mU/l; category 2 represents a geometric mean TSH of 0.02-0.2 mU/l, and category 3 represents a geometric mean TSH over 0.2 mU/l. Reprinted with permission [54], © 2013 American Society of Clinical Oncology. All rights reserved.

