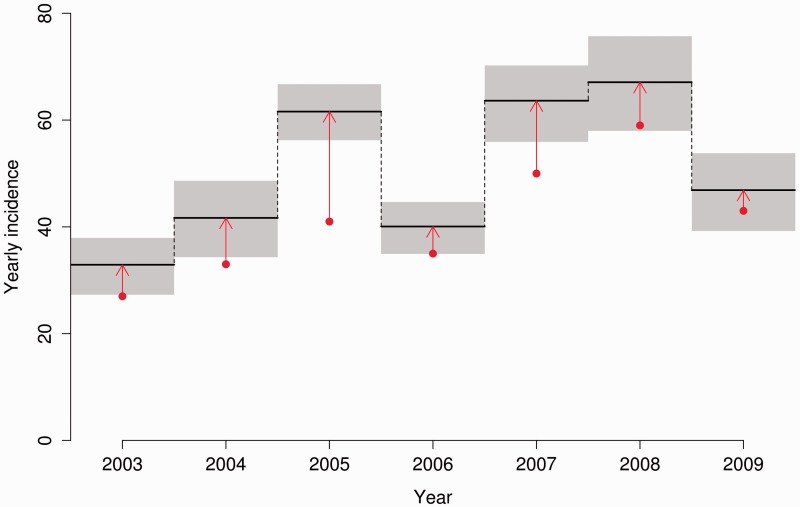
Figure 2.
Incidence of HIV-1 in MSM in Stockholm. Red dots show number of diagnosed cases per year. Black lines, with grey 95% credible intervals, show our yearly incidence estimates. Red arrows indicate the increase over the number of diagnosed cased that our novel method infers based on BED results and corrections for number of unknown cases.

