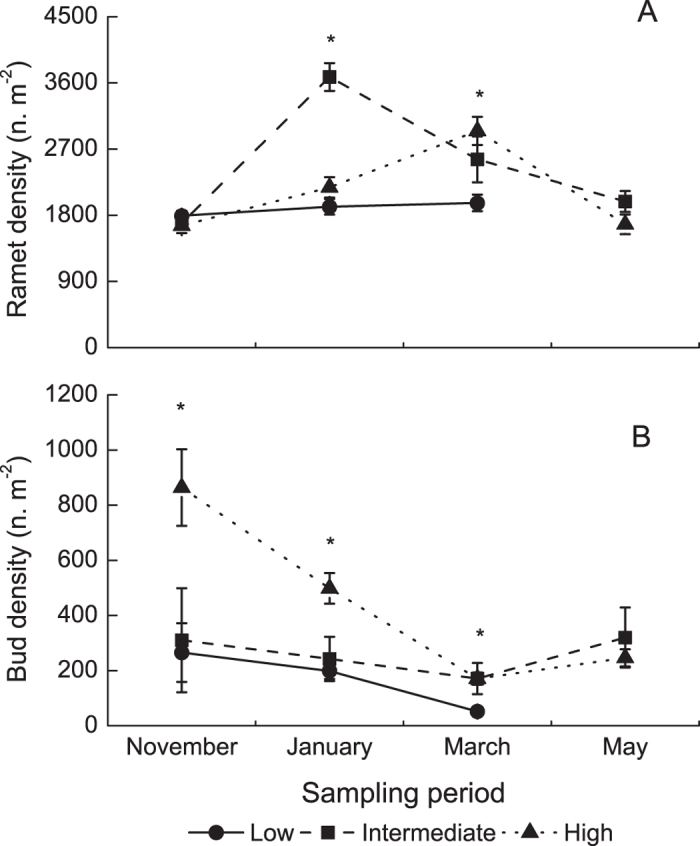
Figure 2. Ramet density.

(A) and bud density (B) at three elevations at the four sampling time points. The data are expressed as the mean ± SE. *P < 0.05.

(A) and bud density (B) at three elevations at the four sampling time points. The data are expressed as the mean ± SE. *P < 0.05.