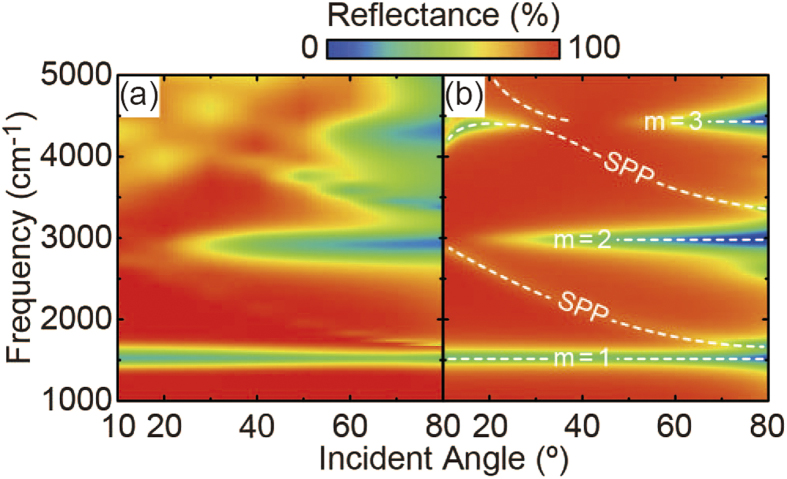
Figure 2. IR characterization of metamaterial absorber.
(a) Measured reflectance map of the metamaterial absorber as a function of incident angle and frequency. (b) Numerically simulated reflectance map, which well re-produced the experimental result qualitatively and quantitatively. The white dotted curves in (b) indicate the excited plasmon modes.

