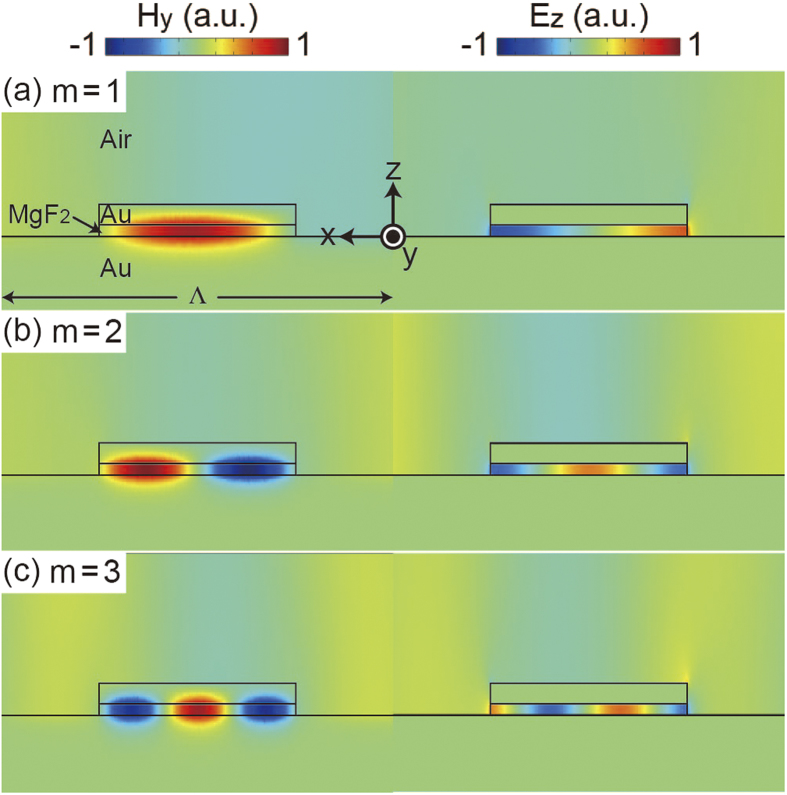
Figure 3. Mode profiles of metamaterial absorber.
Corresponding Hy and Ez distributions of the major absorption dips at θ = 80° in Fig. 2(b): (a) m = 1 at 1540 cm−1, (b) m = 2 at 3013.3 cm−1, and (c) m = 3 at 4476.6 cm−1. All figures were vertically enlarged 3 times for clarity.

