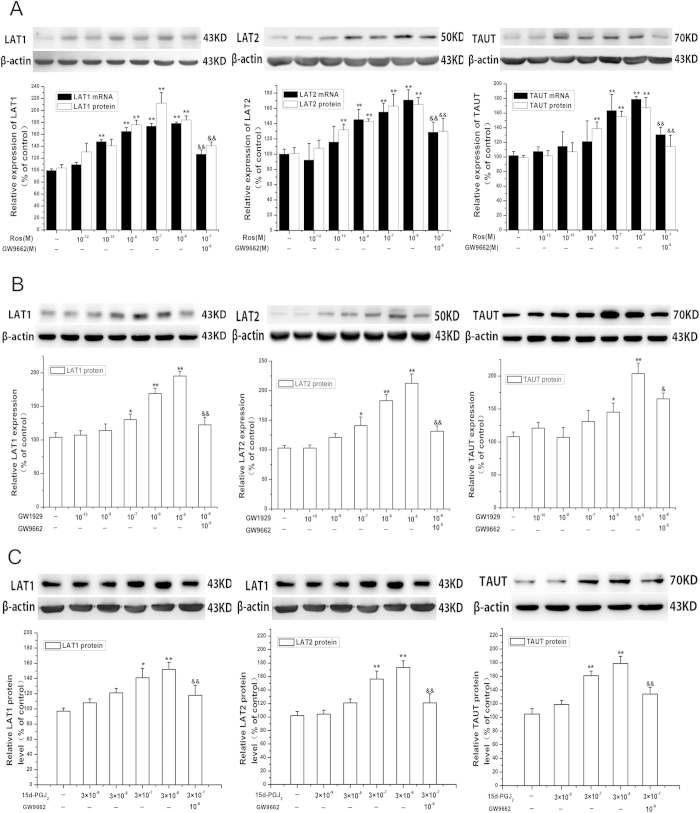
Figure 2. PPARγ stimulates the expression of LAT1, LAT2 and TAUT in cultured placental trophoblast cells.
(A) the effects of rosiglitazone on the expression of LAT1, LAT2 and TAUT. Primary trophoblast cells were treated with increasing concentration of rosiglitazone (10−12–10−6 M) for 24 h in the presence or absence of PPARγ antagonist GW9662 (10−6 M) for 24 h. The cells were then harvested for determination of LAT1, LAT2 and TAUT mRNA and protein levels as described in Methods. Representative protein bands are presented on the top of corresponding histogram. Data are presented as mean percent control ± SEM of five cultures (n = 5) performed in triplicate. Ros, rosiglitazone. *P < 0.05, **P < 0.01 vs control; &&P < 0.01 vs Ros. B &C, Ros. B &C, the effects of GW1929 (B) and 15d-PGJ2 (C) on LAT1, LAT2 and TAUT expression. Trophoblast cells were treated with increasing concentration of GW1929 (10−9–10−5 M) or 15d-PGJ2 (3 × 10⁻⁹–3 × 10⁻⁶ M) for 24 h in the presence or absence of GW9662 (10−6 M) for 24 h. The cells were then harvested for determination of LAT1, LAT2 and TAUT mRNA and protein levels. Data are presented as mean percent control ± SEM of four cultures (n = 4) performed in triplicate. Representative protein bands are presented on the top of corresponding histogram.*P < 0.05, **P < 0.01 vs control; &P < 0.05; &&P < 0.01 vs GW1929 or 15d-PGJ2.

