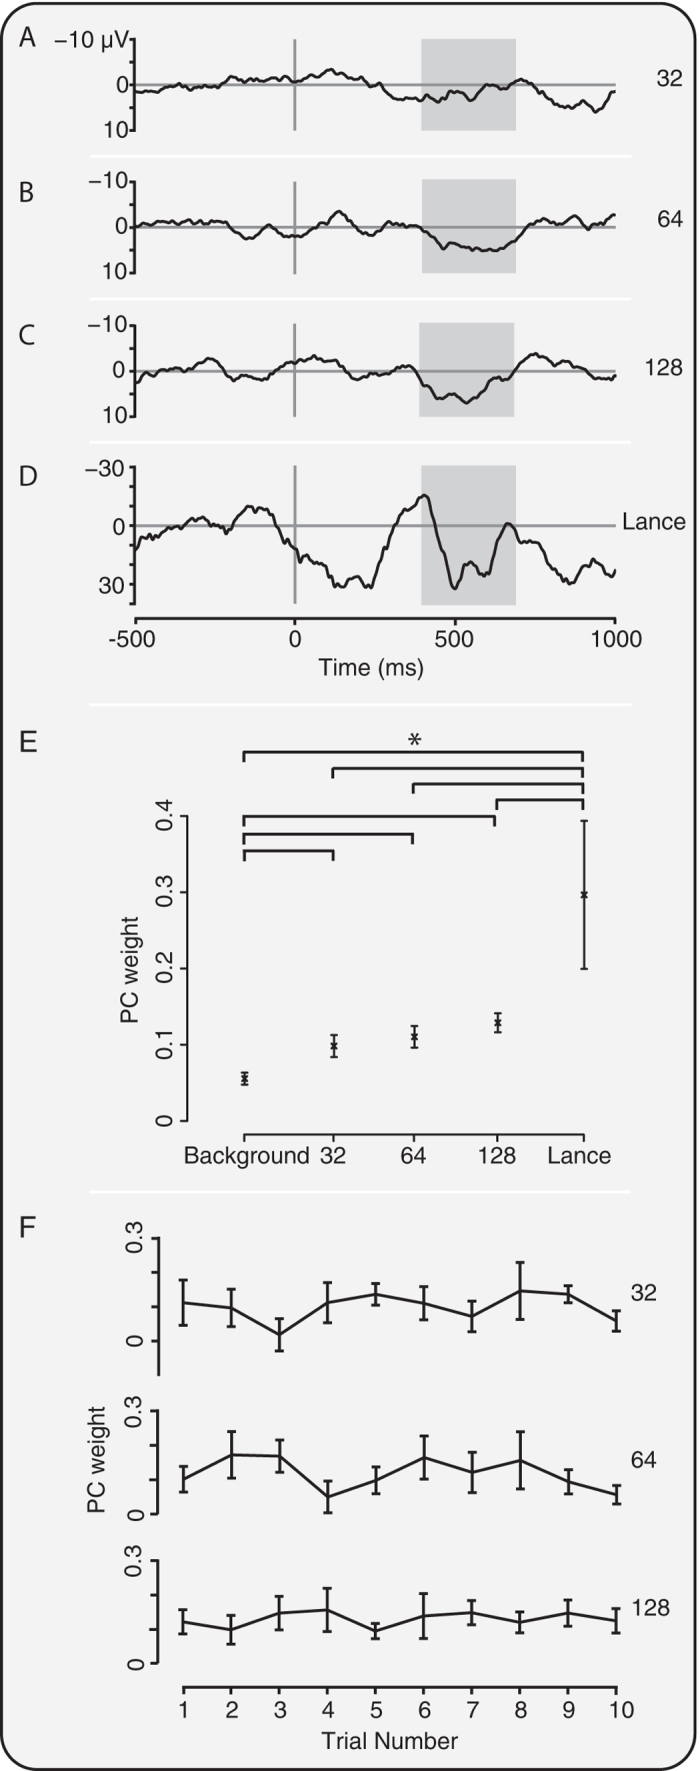
Figure 2. Experimental noxious stimuli evoke nociceptive-specific brain activity.

Average traces (without Woody filtering jitter) in response to the (A) 32 mN, (B) 64 mN, and (C) 128 mN experimental noxious stimulus, and (D) clinically required heel lance. (E) PC weight of the nociceptive-specific brain activity was graded with intensity and was significantly different to background data following all the experimental noxious stimuli and heel lance (*p < 0.05). (F) PC weight did not significantly change with stimulus number for any of the experimental noxious stimuli. Error bars indicate standard error of the mean. Grey boxes indicate the time window 400–700 ms.
