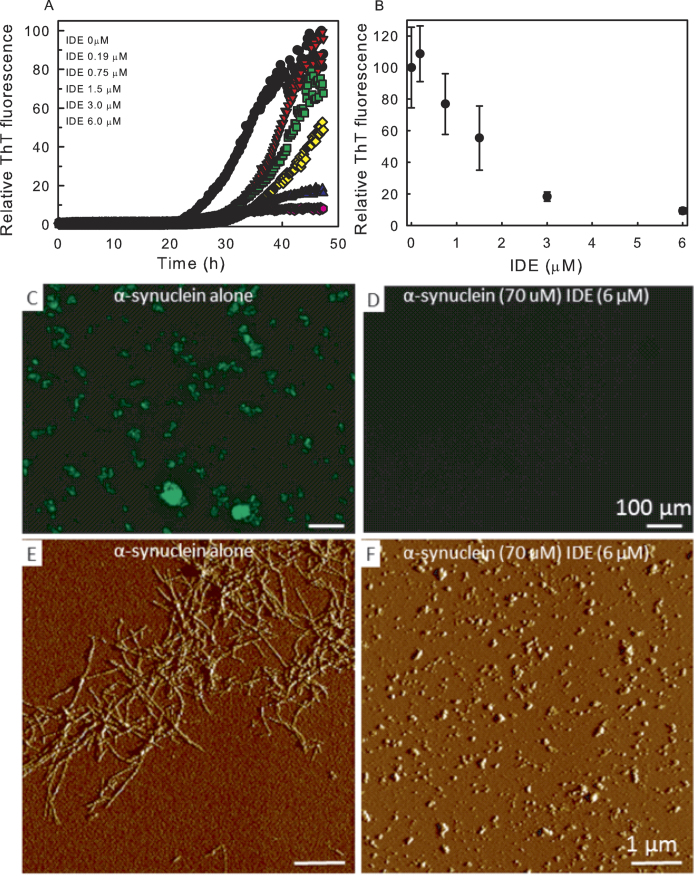
Figure 1. Effect of IDE on α-synuclein amyloid formation.
(A) ThT fluorescence versus time (37 °C, agitation) probing amyloid formation of 70 μM α-synuclein without and with the presence of various concentrations of IDE between 0.2 and 6.0 μM. (B) Normalized ThT emission after 48 h of incubation (endpoint of experiments) for α-synuclein in the presence of varying concentrations of IDE. Error bars refer to triplicate experiments. Fluorescence microscopy of α-synuclein samples after ThT assays without (C) and with (D) the presence of 6 μM IDE (excitation of ThT). Scale bar 100 μm. AFM images of α-synuclein after ThT assays without (E) and with (F) the presence of 6 μM IDE. Scale bar 1 μm.

