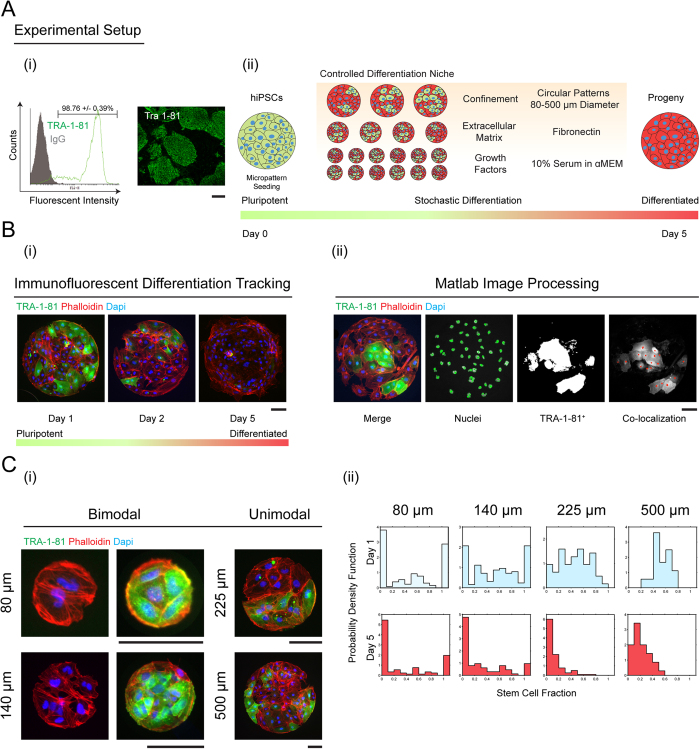
Figure 1. Homogenous hiPSC population matured on circular micropatterns show non-homogeneous differentiation dynamics depending on the size of confinement.
(A) (i) hiPSCs are plated on fibronectin coated circular substrates ranging from 80–500 μm in diameter. Cell seeding density is 100,000 per coverslip. The initial cell hiPSC population is 98.67 +/− 0.39% pluripotent as demonstrated by TRA-1-81 flow cytometry and staining data. (ii) Hundreds of identical micropatterns are replicated in the same culture. Cells grow and differentiate for 5 days. (B) (i) Differentiation demonstrated by loss of green intensity (ii) The cell culture is fixed and stained at regular intervals and images are processed and quantified for each micropattern. The number of stem and differentiated cells are recorded to obtain population distributions. The image analysis algorithm is discussed in the SM. (C) (i) Representative images of stem cell populations grown for 1 day on circular micropatterns. (ii) Probability density functions of stem cell fractions quantified from (i) showing bimodal probability distributions of stem cells on smaller (80 and 140 μm) and unimodal distributions on larger (225 and 500 μm) diameter micropatterns. The 80 and 140 μm micropatterns show that it is very probable to observe a micropattern with 100% stem cells or 100% differentiated cells. For the larger 225 and 500 μm micropatterns, the opposite is true (TRA-1-81 in green; phalloidin in red; nuclei in blue; scale bars are 100 μm).

