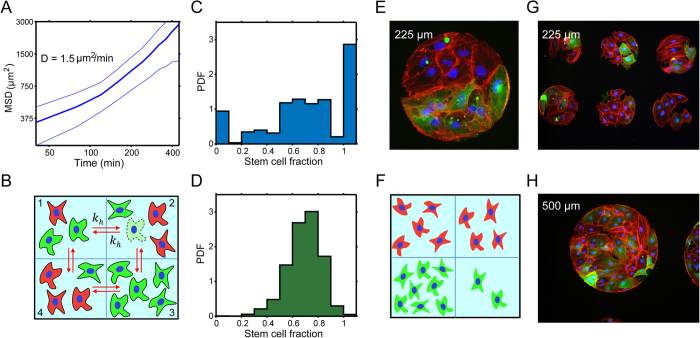
Figure 3. Cell motility and cell-cell interaction can explain spatial patterns seen on larger micropatterns.
(A) Measured means squared displacement versus time for stem and differentiated cells, giving a diffusion constant of 1.5 μm2/min. (B) A compartment model for large micropatterns. A 225 μm pattern can be viewed as four, 80 μm patterns connected together. Cells within each compartment are well mixed and interact with each other. Cells can also migrate between adjacent compartments, modeled by stochastic hopping rates kh. (C) Computed stem fraction probability distribution for a single compartment within the large micropattern. The compartment shows the same identical bimodal behavior as the smaller micropatterns. (D) Computed stem cell fraction distribution for the large micropattern when four compartments are summed. This distribution is unimodal, in accord with observations in Fig. 1C. (E) An example immunofluorescence image showing spatial domains within the 225 μm micropattern. Lower half are dominated by stem cells. (F) A sample simulated 225 μm micropattern, showing similar micro domains dominate by stem cells. The simulations are performed using a Gillespie algorithm described in the SM. Additional examples of immunofluorescence images of spatial patterns seen (G) on 225 μm and (H) 500 μm micropatterns after one day of differentiation. (TRA-1-81 in green; phalloidin in red; nuclei in blue; scale bars are 100μm).

