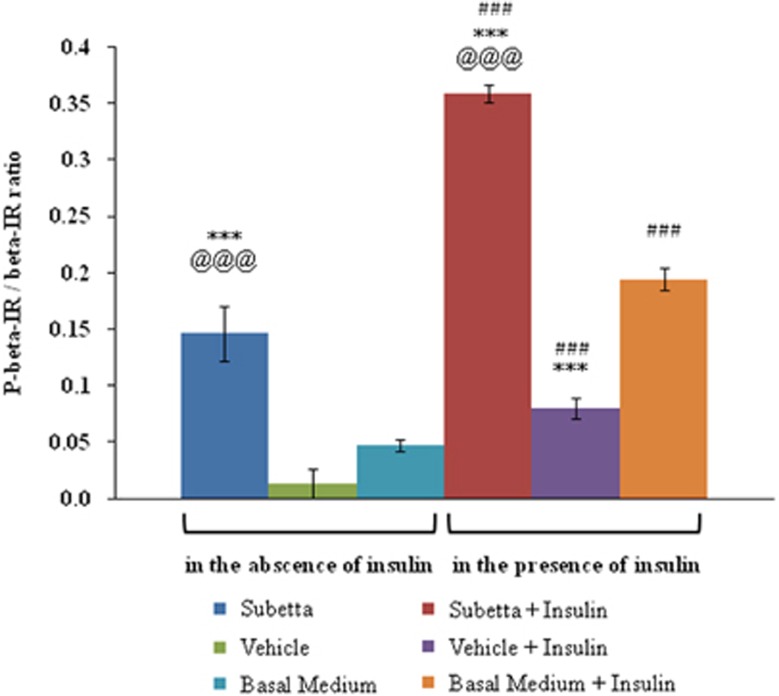
Figure 1.
Effect of Subetta on ‘phosphorylated-IR β-subunit/total IR β-subunit' ratio. Data are expressed as means±s.d. from triplicate. One-way analysis of variance (ANOVA) followed by Tukey's honest significant difference test was used for statistical analysis. ANOVA shows the following results: F11/24=162.83, P=0.0000, observed power=1.0. Bartlett's test confirmed equality of variances between the groups (Bartlett test of homogeneity of variances data: result by group Bartlett's K2=10.3198, d.f.=11, P-value=0.5019, P>0.05). ***P<0.001 versus ‘basal medium' in the absence of insulin or versus ‘basal medium+insulin' in the presence of insulin; @@@P<0.001 versus ‘vehicle' in the absence of insulin or versus ‘vehicle+insulin' in the presence of insulin; ###P<0.001 versus respective in the absence of insulin.

