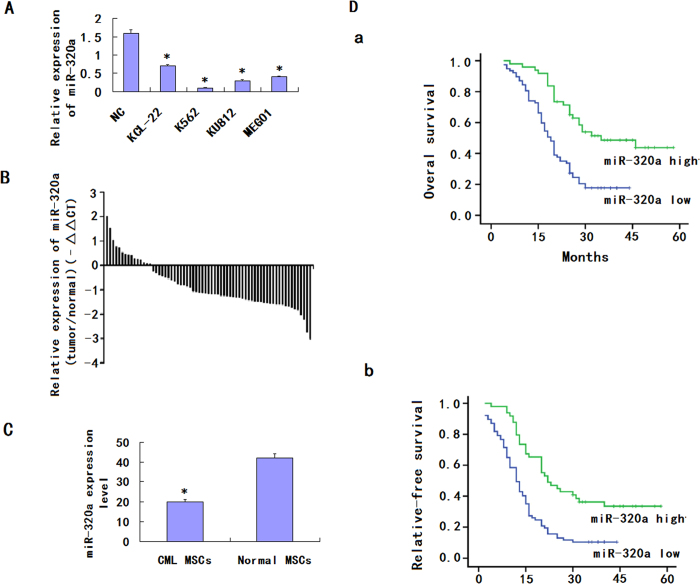
Figure 1. Downregulation of miR-320a expression in CML cell lines and CML cancer stem cells compared with the corresponding controls.
(A). Relative expression of miR-320a in 4 CML cell lines and one normal control were detected by qRT-PCR. All experiments were repeated at least three times. Each bar represents the mean of three independent experiments. *P < 0.05. (B). Relative expression of miR-320a in 70 specimens of CML cancer stem cells and normal MSCs were carried out by qRT-PCR. Data are shown as –△△CT values. (C) The mean and standard deviation of miR-320a expression levels in 70 specimens of CML cancer stem cells and normal MSCs were shown. Data are presented as 2−△Ct values (**P < 0.01). (D). Survival analysis of CML. OS and RFS curves for 90 CML patients with high or low miR-320a expression were constructed using the Kaplan-Meier method and evaluated using the log-rank test.

