
Figure 3. Assessment of Profilin-1 self-assembly.
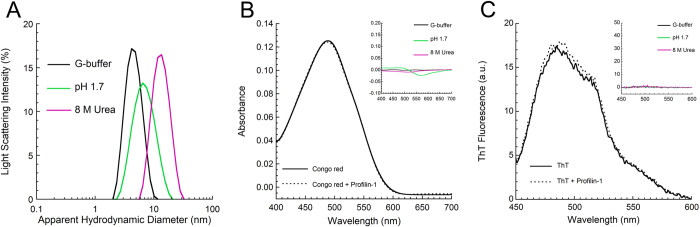
(A) Size distributions of profilin-1 samples obtained with DLS under three conditions: G-buffer (black), pH 1.7 (green) and in 8 M urea (magenta). (B) CR optical absorption spectra measured in the absence (continuous line) and presence (dashed line) of profilin-1 in G-buffer. The inset shows the difference between the CR absorption spectrum recorded in the presence and that recorded in the absence of the protein under the same conditions listed in panel (A). Color code as in panel (A). (C) Fluorescence emission spectra of ThT in the presence (dashed line) and absence (continuous line) of profilin-1 in G-buffer. The inset shows the difference between the ThT emission spectrum recorded in the presence and that recorded in the absence of the protein under the same conditions listed in panel (A). Color code as in panel (A).