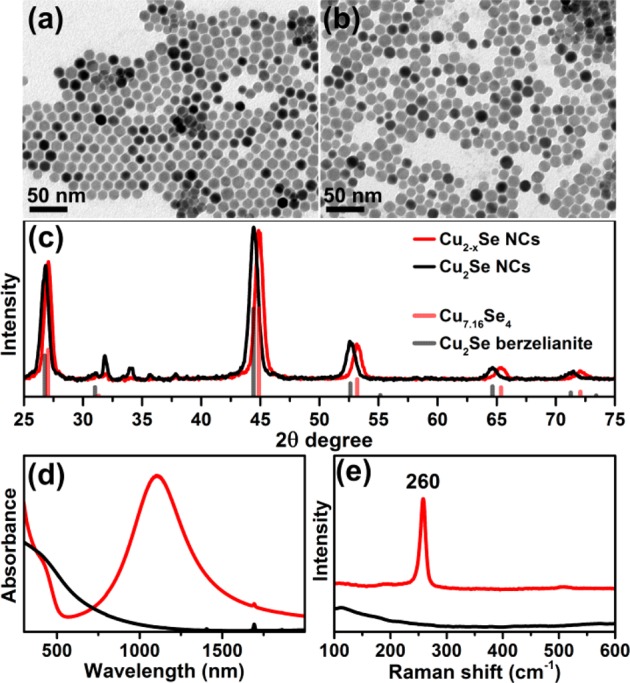
Figure 1.

TEM images of initial (a) and reduced Cu2–xSe (b) NCs with corresponding XRD patterns (c) (red, before reduction; black, after reduction). The experimental patterns are compared to database powder diffraction files of cubic Cu7.16Se4 (PDF card #01-071-4325) and Cu2Se berzelianite (01-071-4843). Optical absorption spectra of Cu2–xSe NCs before (red) and after reduction (black)47 (d) and corresponding Raman spectra (e).
