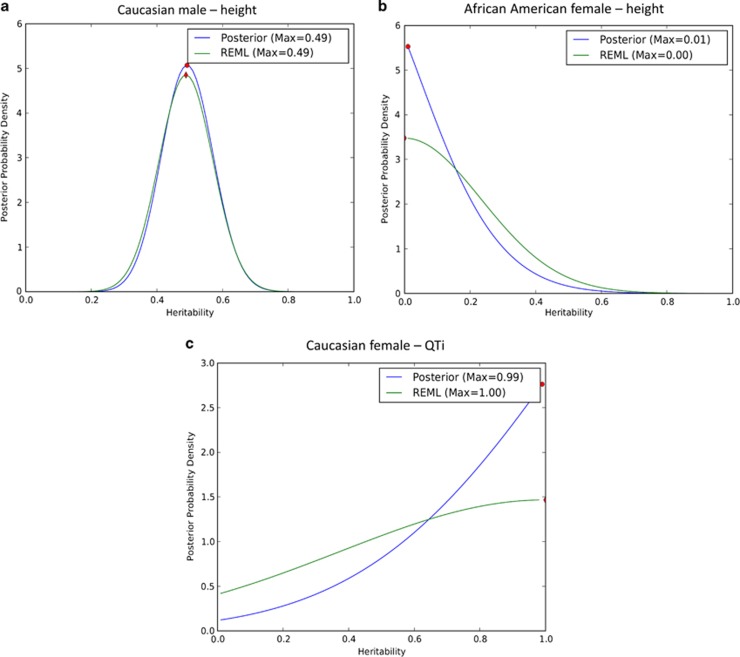
Figure 2.
Comparison of maximum-likelihood estimator distribution with posterior distribution for the examples of (a) height in Caucasian males, (b) height in African American females, and (c) QTi in Caucasian females. Shown are frequentist estimates of the variation of the heritability estimate obtained from GCTA (constrained to values of heritability between 0 and 1) and Bayesian posterior distributions. The area under each distribution is 1. A red dot indicates the maximum of each curve.

