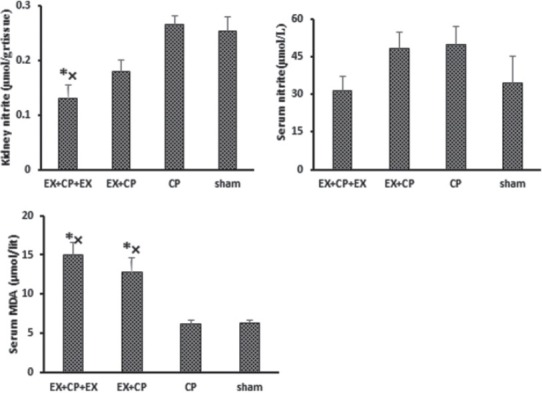
Figure 3.

Serum levels of nitrite and malondialdehyde, and kidney tissue level of nitrite. *indicates significant difference from the negative control (sham) group, ×indicates significant difference from the positive control (cisplatin) group (P < 0.05)
