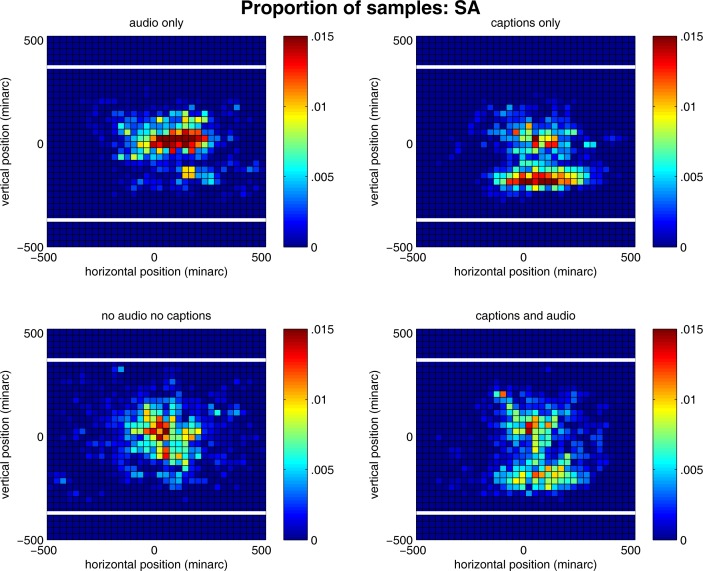
Figure 2.
Three-dimensional plot of sampled eye positions during a trial (excluding samples during saccades) for subject SA for each viewing condition (audio only, captions only, neither, and both captions and audio). Data for each condition are pooled across the four clips viewed in that condition. The x and y axes represent horizontal and vertical position, respectively, in minutes of arc. Color represents the proportion of samples. The horizontal white lines indicate the vertical display boundaries. The horizontal boundaries of the display coincided with the horizontal boundaries of the plot.

