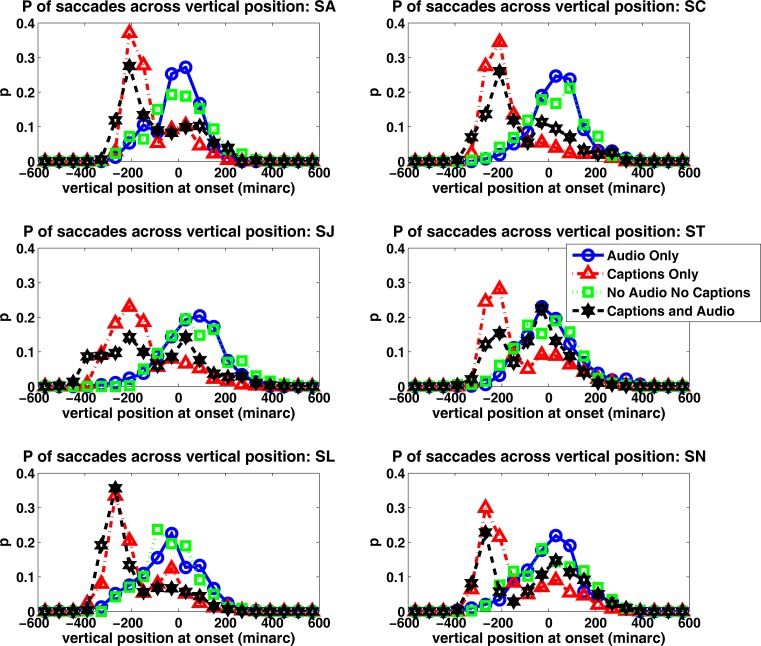
Figure 3.
Histograms showing the proportions of saccades originating from different vertical positions for each viewing condition (audio only; captions only; no audio, no captions; both captions and audio). Data from six subjects. Each histogram is based on approximately 2094 to 3554 saccades. Differences across the conditions were significant, F(3, 22293) = 1885, p < 10−5.

