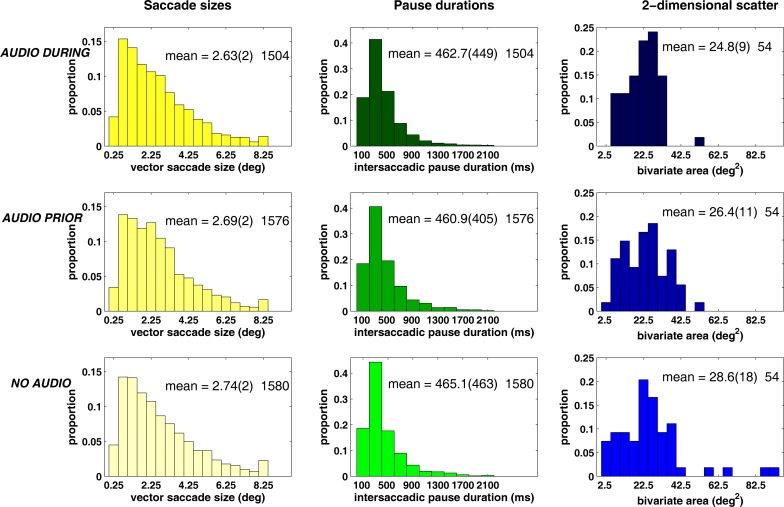
Figure 6.
Left: distributions of the proportions of saccade sizes with half-degree bins. Middle: distributions of proportions of pause durations (plots were truncated so that pause durations >2200 ms [<1% of data] are not shown). Right: distributions of the proportions of bivariate contour ellipse areas with 5 deg2 bins. Each histogram contains data from all subjects and trials.

