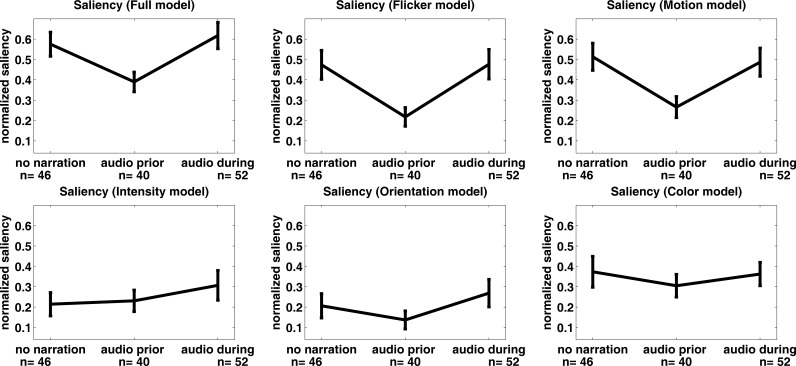
Figure 8.
Average normalized saliency values at fixated locations in the three narration conditions. Different panels represent the different feature dimensions and the composite saliency model. Error bars represent ±1 standard error. The number of trials used to compute each mean can be found below the x axis.

