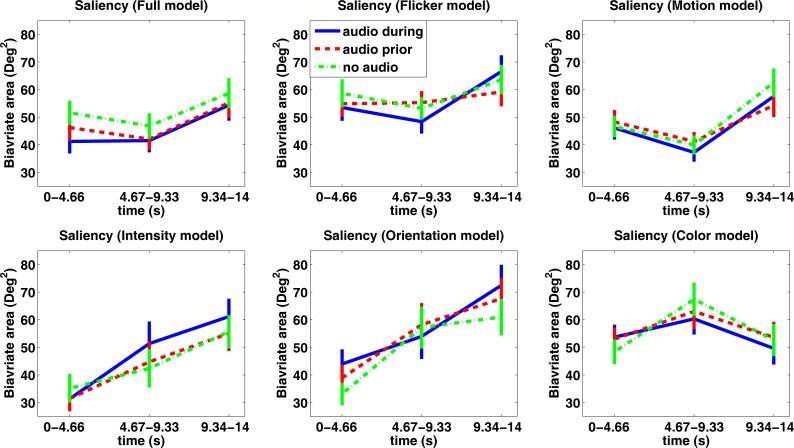
Figure 9.
Average bivariate contour ellipse area (deg2) of location of highest salience in three sequential 5 s epochs spanning the length of the trial (15 s). Each mean is based on 54 trials (18 Ss × 3 trials/subject). Different panels represent the different feature dimensions and the composite saliency model. Error bars represent ±1 standard error.

