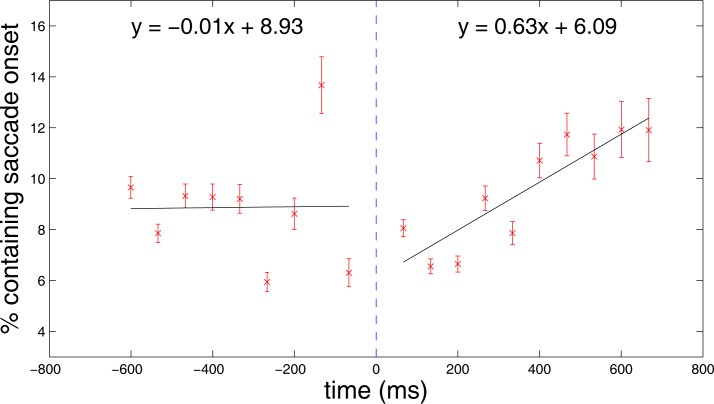
Figure 10.
Percentage of abrupt changes containing saccade onsets in each of nine sequential 66 ms epochs prior to an abrupt scene cut and 10 epochs following a cut. The best fit line for each set of data (pre and post cut) are also shown. Error bars represent ±1 standard error. The vertical dashed blue line represents the onset of the frame immediately following a cut. After the first saccade onset occurred in a given sequence of frames, the frames immediately following were not analyzed (see text).

