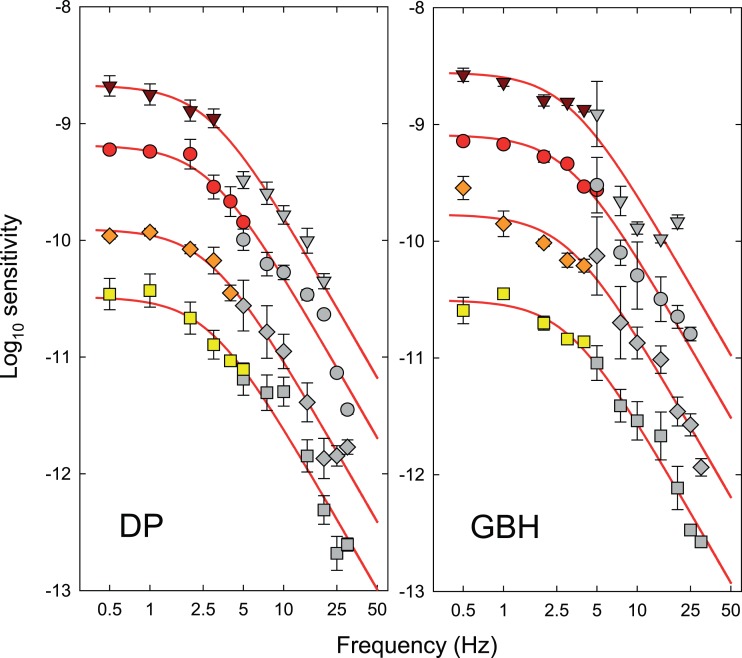
Figure 7.
Estimates of the logarithmic sensitivities corresponding to the attenuation characteristics of the late filter for DP (left-hand panel) and GBH (right-hand panel) at each of the four time-averaged radiance levels of 9.10 (triangles), 9.70 (circles), 10.33 (diamonds), and 10.93 (squares) log10 quanta s−1 deg−2. Error bars indicate ±1 SEM. The colored symbols show the logarithmic sensitivities for detecting the hue change at fm as a function of fm from Figure 4 rescaled according to the input versus output contrast functions shown in Figure 6. Each set of data has been vertically aligned so that it has the same maximum amplitude sensitivity in log10 quanta s−1 deg−2 before and after rescaling. The grey symbols are the sensitivity differences between the early filter estimates (colored symbols, Figure 3) and the chromatic TCSF measurements (grey symbols, Figure 3). The alignment of the grey symbols with the colored ones was determined by the fit of a two-stage low-pass filter model (red lines), the details of which are described in the text. Error bars indicate ±1 SEM.

