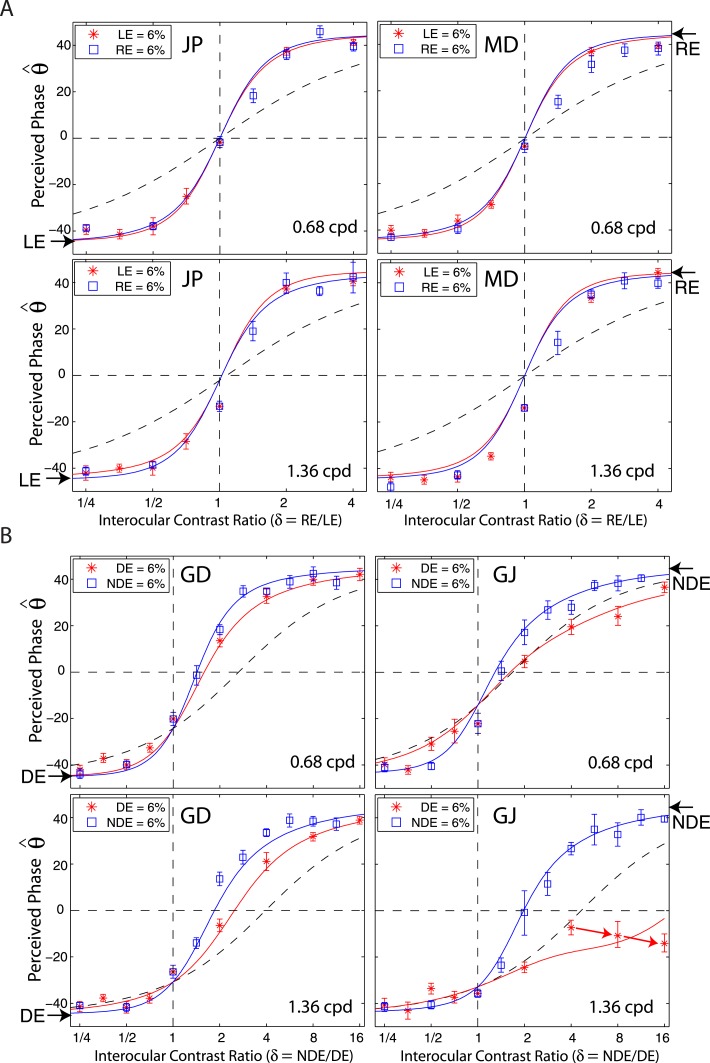
Figure 5.
Redrawing the results of Experiment 1 for amblyopes and normal observers when the DE's (LE's) contrast remained constant at 6% (red stars) (constant-DE-contrast condition) or when the NDE's (RE's) contrast remained constant at 6% (blue squares) (constant-NDE-contrast condition). The solid colored curves are the best fit from the DSKL model and the black dashed curve is the prediction of linear summation. Red arrows indicate data points where the perceived phase shifted to the DE when the NDE's contrast increased.

