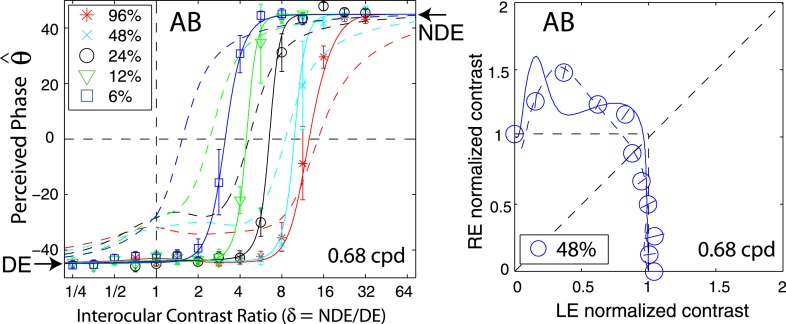
Figure 13.
Comparison of the perceived phase before (solid curves) and after (dashed curves) stereo training. Because no contrast data were collected before training, the DSKL model was fit to both phase data (left) before training and contrast data (right) after training. The dashed curves are predictions from the DSKL model fitted to both phase (Figure 2B) and contrast (Figure 8) data after training.

