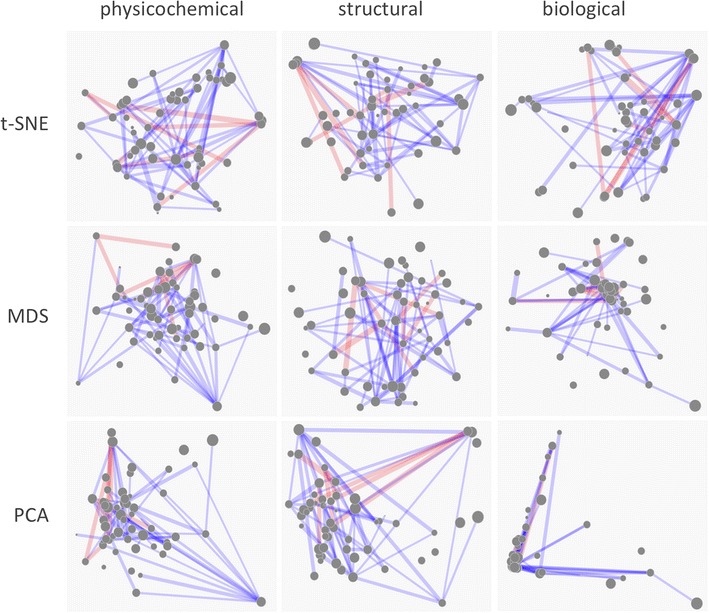
Fig. 5.

Synergy Maps. Sample static networks. Nodes represent compounds, with radius indicating relative pIC50. Edges represent combinations, with thickness indicating degree of non-additivity, and red and blue indicating antagonism and synergy respectively. It appears that whilst PCA is a passable dimensionality reduction algorithm for physicochemical and structural space (despite concentrating points in the centre), it does not differentiate the compounds well in biological space. MDS does a little better, yet ultimately still concentrates points towards the centre, preventing compounds from being easily being differentiated. In the authors’ opinion, t-SNE performs well in all spaces; clear clusters can be seen, identifying groups of compounds similar in that space, yet points are still spread across space helpfully so as not to clutter the visualization.
