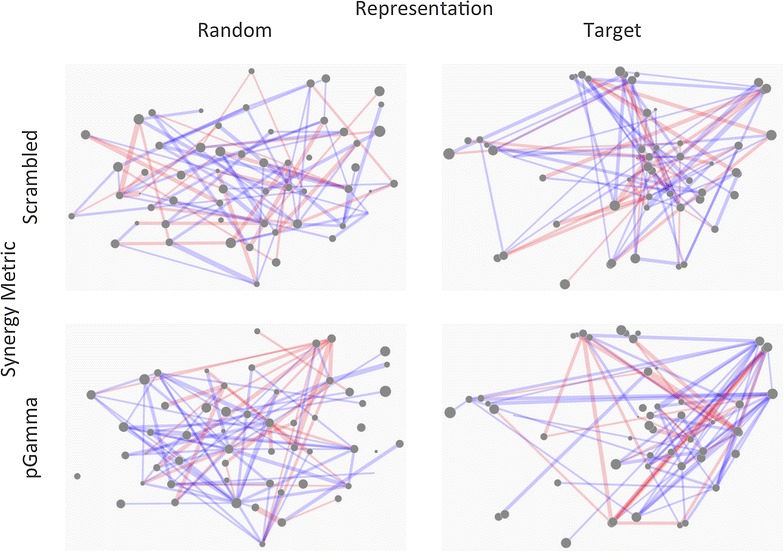
Fig. 8.

Validation through randomization and scrambling. In order to assess the meaningfulness of potential hypotheses drawn from a synergy map, it is advantageous to compare with random data, such as those in the figure, to protect against spurious correlations being interpreted for more than they are. The random compound positions (leftmost maps) are generated using random feature vectors, which were then reduced using t-SNE in an identical fashion to the Bayes Affinity vectors (rightmost maps). The random positioning of compounds appears not to produce the clusters observed when real data is used. Randomly shuffling the combinations values (topmost maps) reveals more realistic maps—there are several clusters which appear to share many synergies, for which hypotheses may have been proposed, illustrating the danger of overinterpretation of synergy maps.
