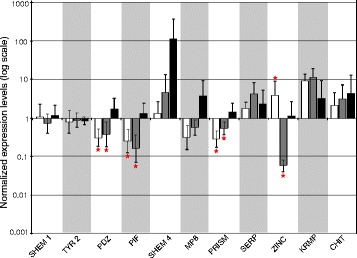
Fig. 5.

Relative gene expression levels obtained with the individual analysis. For each tested gene, the white histogram represents the expression in the full albino phenotype (FA), the grey histogram in the half albino (HA) and the black histogram in the black phenotype (C). Significant differential expressions in phenotypes (FA) and (HA) relative to phenotype (C) (determined by an ANOVA) are indicated by a red star
