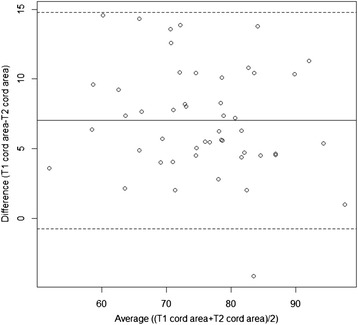
Fig. 3.

Bland-Altman plot showing all subjects – units of measure = mm2. T1 normalized cord areas are higher than T2 areas (estimated mean difference = 7.03 mm2; 95 % CI: 5.91, 8.14; p < 0.0001). Only one subject had a higher T2 normalized cord area than T1
