Fig. 10.

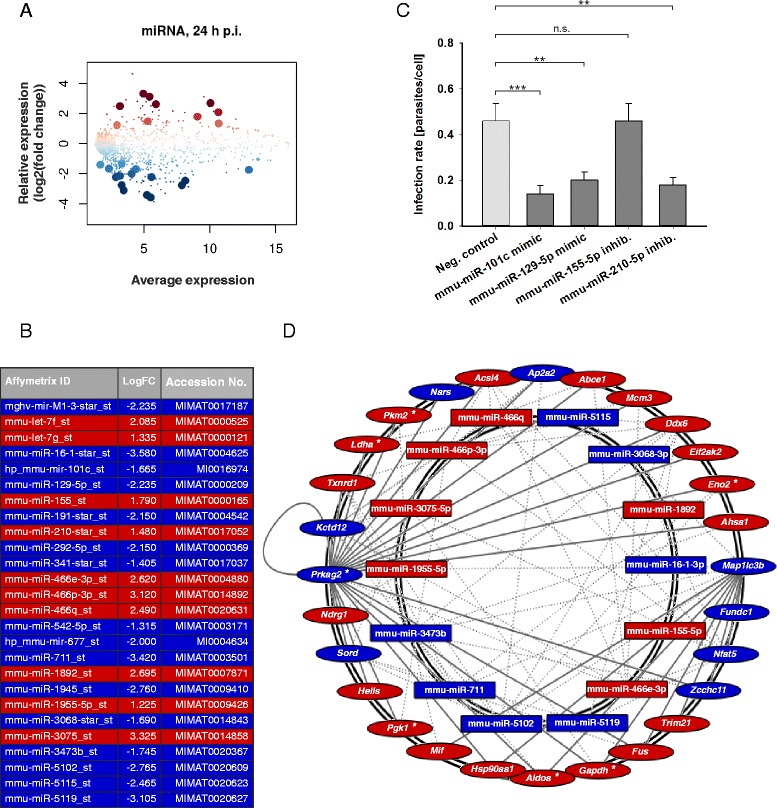
Global analysis of differentially expressed miRNAs in L. m.-infected BMDM, bioinformatical prediction of miRNA interactions with LISA, and infection rates of L. m.-infected BMDM after transfection with mmu-miR-101c or mmu-miR-129-5p mimics as well as mmu-miR-155-5p or mmu-miR-210-5p inhibitors. Methods: (a, b, d) BMDM from BALB/c mice were infected with L. m. promastigotes for 24 h. Uninfected control BMDM were incubated for the same amount of time in RPMI medium. Total RNA was harvested from L. m.-infected BMDM and uninfected control BMDM. Affymetrix® chips were hybridized with RNA samples from 2 independent experiments and analyzed densitometrically. Putative interactions between differentially expressed miRNAs and LISA members were predicted bioinformatically and represented in MONA-of-LISA. c Additionally, L. m.-infected BMDM were transfected with miRNA mimics or inhibitors 20 h p.i.. L. m.-infected control BMDM were transfected with a negative control of miRNA mimics or inhibitors. The infection rates were determined 48 h p.i. in 2 independent experiments. Results: (a, b) Differentially expressed miRNAs were detected in L. m.-infected BMDM 24 h p.i.. The results were presented in MA plots. Large dots represent probe sets, which were significantly and differentially expressed (FDR < 0.05). Dot and table colors correspond to the direction of miRNA expression changes (red = significant upregulation; blue = significant downregulation). b Table shows the significantly regulated miRNAs at 24 h p.i.. Accession No. provides detailed information about respective miRNA in (http://www.mirbase.org/). c A significant decrease in the infection rates was detected in L. m.-infected BMDM after transfection with mmu-miR-101c, mmu-miR-129-5p, and mmu-miR-210-5p compared to L. m.-infected BMDM transfected with a negative control of miRNA mimics or inhibitors. Transfection with mmu-miR-155-5p did not change the infection rate. d Putative interactions of differentially expressed miRNAs with LISA were identified and presented in MONA-of-LISA. Dotted gray lines show connections between the miRNA and the mRNAs of LISA. Solid gray lines are the connections between mRNAs already known from LISA. Node colors correspond to the direction of the gene product expression changes (red nodes = significant upregulation; blue nodes = significant downregulation). Accession No. = Accession number, Affymetrix ID = Affymetrix identifier, inhib. = inhibitor, logFC = log(fold change), neg. control = negative control, n.s. = not significant, p.i. = post infection,* = genes of glycolysis,** p ≤ 0.01, *** p ≤ 0.001
