Fig. 1.

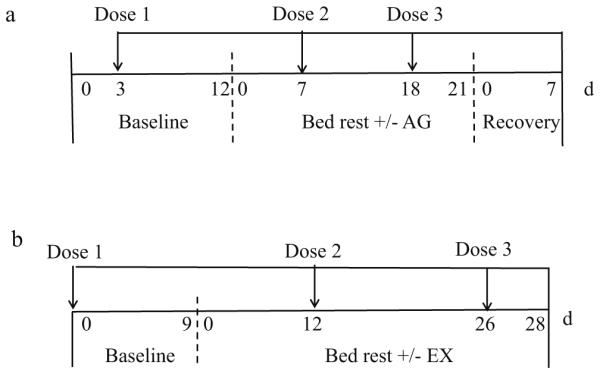
Study design showing the length of baseline, bed rest, and recovery periods for the AG study (a) and EX study (b). The times of the three doses of tracer administration are indicated by the arrows above the timeline for each study

Study design showing the length of baseline, bed rest, and recovery periods for the AG study (a) and EX study (b). The times of the three doses of tracer administration are indicated by the arrows above the timeline for each study