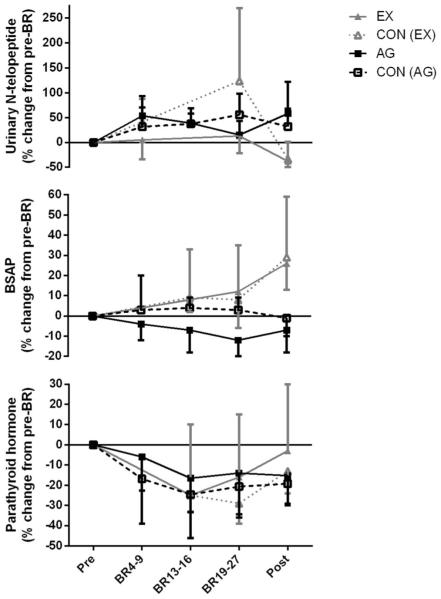
Fig. 4.
Urinary N-telopeptide, serum bone-specific alkaline phosphatase (BSAP), and serum parathyroid hormone, before, during, and after bed rest. To simplify the figure, the x-axis time points were averaged into the groupings presented, but all statistical analyses were performed on the raw data that are presented in the online resources

